


The Big Idea
An introduction to agency ARMs
Chris Helwig | July 17, 2026
This material is a Marketing Communication and does not constitute Independent Investment Research.
For much of the past two decades, agency MBS issuance has been dominated by fixed-rate mortgages. More recently, however, issuance of adjustable-rate mortgages (ARMs) has increased, creating renewed investor interest in an asset class with materially different cash flow, prepayment and valuation characteristics. Given the long-dated dearth in issuance, many market participants may not be familiar with the nuances of ARM cash flows, while others could likely use a refresher course.
ARMs have been a part of the U.S. mortgage market since the late 1970s, born from the practice of Savings and Loan institutions funding longer term fixed-rate mortgages with short-term liabilities. Liability costs rose dramatically against the backdrop of unconstrained inflation during the Carter administration. In response to this, S&Ls began offering mortgages with adjustable rates that could float directionally with their liabilities. Their wider adoption came in 1982, under the Garn-St Germain Depository Institutions Act which authorized adjustable-rate mortgages nationwide.
The analysis below will describe in detail the life cycle of an ARM pool including;
- Origination and issuance
- Cash flow structure
- Underwriting
- Prepayment considerations
- Cash flow valuation and relative value
Origination and issuance
Before the 2008 Global Financial Crisis, ARM loans accounted for more than half of all originations. Weaker private label underwriting framework drew large swaths of subprime borrowers away from FHA and into private label ARM loans as they could secure financing at lower rates. Subprime and ARM originations grew geometrically in the run-up to the crisis.
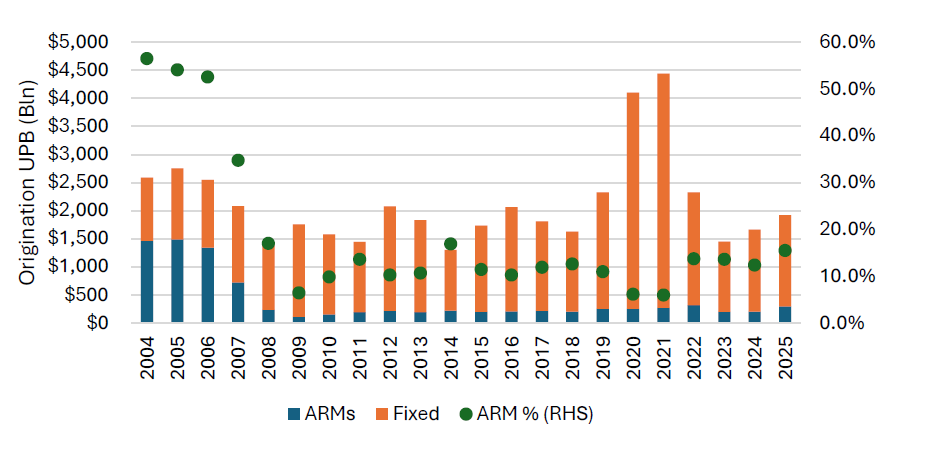
Many subprime ARMs ultimately defaulted. The profile of the ARM borrower changed drastically. ARM borrowers went from subprime credits to super-prime ones. ARM lending went from an originate-to-securitize model to an originate-to-retain one, with the product being primarily offered by banks. ARMs pair far more favorably with a depositories’ liability structure than 30-year, fixed-rate mortgage loans as they are shorter and less negatively convex. So, while ARM originations accounted for nearly 15% of total loan originations in some years, a scant few were securitized as banks retained nearly all originations (Exhibit 1).
Exhibit 1: ARM originations crater in the wake of the GFC
Source: Inside Mortgage Finance, Santander US Capital Markets
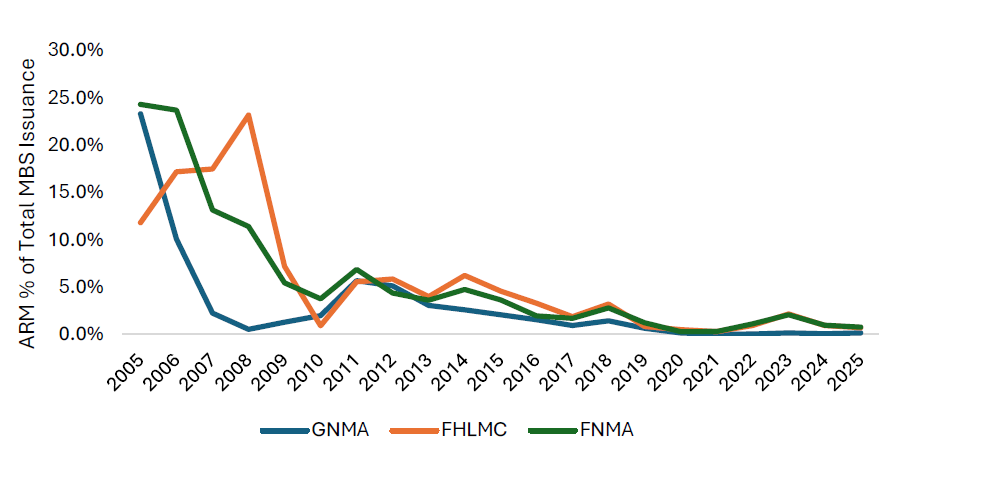
And while subprime credits flowed from the private label market to FHA in the wake of the GFC, those borrowers migrated to more stable, fixed-rate loans. The ARM share of both government and GSE issuance fell dramatically in the wake of the GFC and have contributed very little to gross issuance volumes over the past five years (Exhibit 2). Issuance of agency ARMs has picked up in the first half of this year and they are becoming a more meaningful asset class.
Exhibit 2: ARMs make small contribution to MBS issuance in recent years
Source: Inside Mortgage Finance, Santander US Capital Markets
Cash flow structure
The overwhelming majority of ARMs originated today are hybrids in that the loans feature both a fixed and floating rate. Fixed-rate tenors are determined at origination and can be three, five, seven or 10 years, after which the loan will convert to a floating-rate instrument. Several terms determine the floating rate coupon including:
- The frequency at which it resets
- The period over which the floating-rate benchmark is calculated
- The instrument or index used to calculate the floating rate
- The fixed spread, or ‘margin’ over the benchmark rate
- The cap structure of the loan which will govern how much the borrower’s rate can float up (or down) on an initial or annual reset and for the life of the loan.
Ginnie Mae ARMs
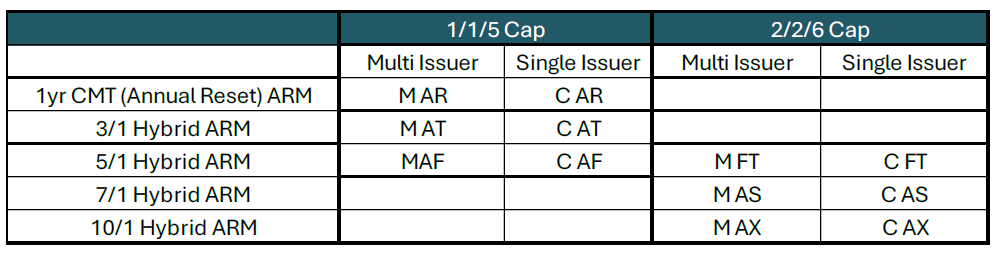
Ginnie Mae ARM pools are backed by adjustable-rate FHA, VA or USDA loans, which are subsequently pooled and guaranteed by Ginnie Mae. These pools are exclusively issued under the GNMA II program and, similar to fixed-rate MBS, can be issued as multi-issuer or single-issuer custom pools. Ginnie Mae pools together eligible annual reset ARMs as well as hybrid ARMs with initial fixed tenors of three, five, seven and 10 years. All newly minted Ginnie Mae hybrid ARMs are indexed to 1Y-CMT, the one-year Constant Maturity Treasury (CMT) index, which reflects the hypothetical interpolated yield of a US Treasury with exactly one year to maturity. Ginnie Mae ARMs carry unique suffix-based pool identifiers based on the tenor of the fixed-rate, cap structure and number of issuers and are as follows (Exhibit 3).
Exhibit 3: Ginnie Mae ARM Pooling Designations
Source: Santander U.S. Capital Markets, Ginnie Mae
Each hybrid ARM will carry a specific cap structure that will determine how much the coupon can float up at different points in the life of the loan: effectively there are a series of caplets within the structure of the loan. The three embedded caps are the initial cap, the periodic cap and the lifetime cap.
- The initial cap governs how much the coupon can reset up (or down) by at the first reset date. The reset window is keyed off the pool’s issue date, not the loan’s origination date and the timing will vary based on hybrid type. The initial reset period will be unique to each class of ARM or hybrid ARM. Reset windows on longer hybrids are a function of specific quarterly dates on which Ginnie Mae ARMs reset.
1-year ARMs will reset exactly 12 months after issue date
3-year hybrids reset 37 to 39 months from issue date
5-year hybrids reset 61 to 63 months from issue date
7-year hybrids reset 85 to 87 months from issue date
10-year hybrids reset 121 to 123 months from issue date
- The periodic cap governs how much the coupon can float by in each subsequent year after the initial reset.
- The life or lifetime cap is the maximum amount the coupon can reset over the life of the loan, irrespective of the level of benchmark rates. The lifetime cap will determine the ‘fully indexed rate,’ the rate at which ARM borrowers generally need to be underwritten to.
There are two cap structures currently employed when Ginnie Mae ARMs are pooled. Annual reset and shorter reset hybrid ARMs use a 1/1/5 cap structure, meaning a maximum 1% initial reset, 1% annual reset and the maximum coupon cannot exceed the initial coupon plus 5%. Longer reset hybrids, mainly 7- and 10-year bonds, along with some 5-year hybrids employ a 2/2/6 cap structure, with maximum initial and periodic resets of 2% and a fully indexed rate 6% greater than the initial coupon.
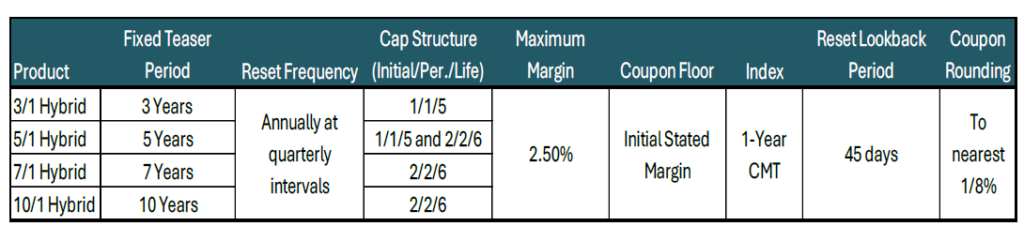
Similar to fixed-rate MBS, all loans backing a pool are not identical. Fixed-rate MBS pools with the same pass-through coupon can have different gross coupons based on the makeup and WAC dispersion of the underlying loans, which in turn can drive idiosyncrasies in prepayments. Similarly, ARM loans backing a pool can differ, with the key variable being the loan margin. Loan margins must be at least 25 bp but no greater than 75 bp over the pool-level margin. The loans’ margins are floored at 125 bp and capped at 325 bp. Margins on securities range from 100 bp to 250 bp and are set in 50 bp increments.
The mortgage loan margin is commonly referred to as the gross margin with the security-level spread being referred to as the net margin. The differential between the two accounts for the portion of the coupon that is being stripped to pay a guarantee fee and to compensate the mortgage loan servicer, along with any excess servicing where applicable (Exhibit 4).
All Ginnie Mae ARMs issued after January 2015 employ a 45-day lookback, meaning they use the published 1-Year CMT value from the lookback date. The margin is then added to the index and the sum is rounded to the nearest one-eighth of a percentage point (0.125%) to calculate the coupon. The calculated coupon would then be either passed through to bond holders or modified as needed to align with any applicable cap prior to being passed through. Ginnie Mae ARMs are all annually reset with coupons being re-struck at the beginning of each quarter of a calendar year (January 1, April 1, July 1, October 1).
Exhibit 4: Ginnie Mae ARM margin, floor and cap comparison
Source: Santander U.S. Capital Markets, Ginnie Mae
Conventional ARMs, key differences from Ginnie Mae
There are a handful of key differences between Ginnie Mae and conventional ARMs away from the obvious direct full faith and credit guarantee on all Ginnie Mae MBS. The major differences between the two include:
- The benchmark index used to calculate the floating rate
- Reset frequency
- Cap structures, margins and coupon floors
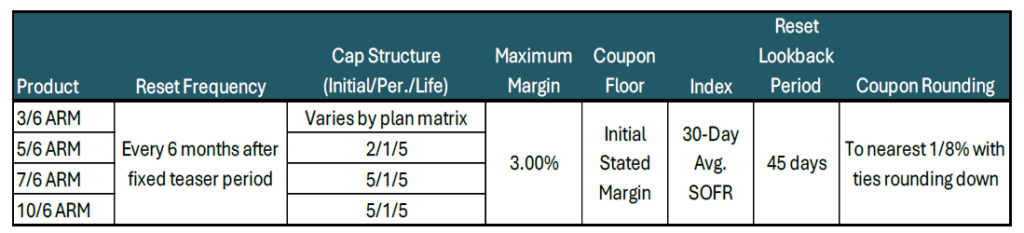
The first major difference between the two pool types is the benchmark index used to calculate the floating-rate coupon. Ginnie Mae ARMs use 1-Year CMT with a 45-day lookback. ARMs delivered to the GSEs must use an average 30-day SOFR rate to calculate the floating-rate coupon. Both government and GSE ARM pools employ the 45-day lookback convention.
Furthermore, conventional ARMs will carry less rate duration as a function of their resets and cap structures relative to Ginnie Mae ARMs. Conventional ARMs reset semi-annually rather than the Ginnie Mae annual reset which will reduce the duration of the post-reset conventional cash flow relative to the Ginnie Mae MBS. Freddie Mac permits margins between 1.00% and 3.00% on the underlying loan purchased by Freddie Mac while Fannie Mae allows for more flexible negotiated margins but are capped at 3.00% as well.
For all Fannie Mae and Freddie Mac ARMs, the coupons are floored at the initial mortgage margin. For practical purposes, the coupon cannot fall below the stated initial margin, even in a case where benchmark rates are negative. Conventional ARMs generally carry higher initial caps than their Ginnie Mae counterparts, ranging from 2.0% to 5.0% (Exhibit 5).
Exhibit 5: Conventional ARM margin, floor and cap comparison
Source: Santander U.S. Capital Markets, Fannie Mae, Freddie Mac
Underwriting Ginnie Mae and conventional ARMs
ARM loans, both government and conventional, are subject to ability-to-repay (ATR) standards and rules when underwritten. And there are unique underwriting criteria to qualify an adjustable-rate borrower relative to a fixed-rate one under Regulation Z. A lender must underwrite the loan based on the maximum rate that could apply during the first five years of the loan, and not just an introductory fixed or ‘teaser’ rate. ARMs that are considered Qualified Mortgages (QM), the lender must use the maximum applicable rate for the first five years of the loan using a payment based on a fully amortizing schedule, meaning that if the fixed term of the hybrid is five years or longer, the borrower can be qualified at that rate. If the teaser period is shorter, then the borrower is generally qualified at the fully indexed rate, the floating-rate benchmark plus the margin at the maximum rate possible during the five-year window, similar to non-Qualified Mortgage loans, with some exceptions.
Ginnie Mae ARM underwriting policies
Underwriting requirements for Ginnie Mae ARMs will vary to some degree depending on both the tenor of the fixed period and the agency which purchases the loan.
- Both FHA and VA annual (1-Year) reset ARMs with LTVs of 95% or greater are qualified at the initial rate plus 1.0%, the maximum possible second-year rate.
- FHA hybrid ARMs are underwritten to the initial fixed teaser rate with no additional payment shock test.
- VA hybrid ARMs are underwritten to the teaser rate as well, but with an additional residual income test required for all loans that the VA purchases. The residual income test is similar to a back end, after tax DTI calculation which measures residual income after; taxes, principal, interest, insurance and property taxes, recurring debt such as auto or student loans and estimated monthly maintenance and utility costs.
Conventional ARM underwriting policies
Conventional ARMs loans are somewhat more conservatively underwritten than Ginnie Mae ARMs in that conventional ARMs with a fixed teaser period of five years or less are qualified at the fully indexed rate. For conventional ARMs the fully indexed rate is calculated as the benchmark index plus the gross margin, rounded to the nearest one-eighth (0.125%) of a percentage point. In the case of a 5/1 ARM with a 5/2/5 cap structure, the fully indexed rate would be 5.0% over the teaser rate.
Prepayment considerations
Borrowers who use hybrid ARM mortgages exhibit different prepayment behavior than borrowers who use fixed-rate mortgages. These prepayment differences lead to faster baseline prepayment speeds and can cause prepayments to increase near resets when rates are high and decrease when rates are low. The loans are also rate sensitive in the “tail” period that follows the first reset; a typical hybrid ARM originated today resets every six months following the fixed-rate period. These differences lift the convexity of hybrid ARMs relative to fixed-rate MBS.
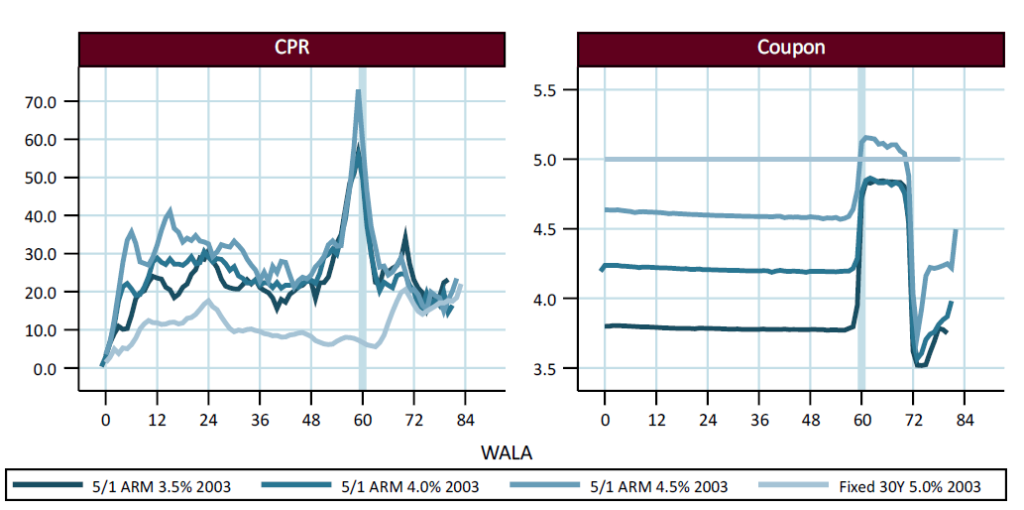
Hybrid ARM prepayment speeds are typically faster than fixed-rate prepayment speeds before the reset when loans are out-of-the-money (Exhibit 6). Most borrowers are risk-averse to the rate reset on the mortgage, so anticipate prepaying their mortgage before the first reset. By choosing a hybrid ARM they are signaling that they anticipate prepaying during the fixed-rate period. The left side of the exhibit shows prepayment speeds for 2003 5/1 ARMs with original coupons of 3.5%, 4.0%, and 4.5% alongside 5.0% 30-year fixed-rate loans. This vintage and timeframe were chosen because there was lots of production and rates were generally higher following origination through the first reset, so refinancing into a lower rate mortgage is not a consideration. Hybrid speeds were generally 20 to 40 CPR pre-reset, while fixed-rate speeds were generally less than 15 CPR during that time.
Exhibit 6: 2003 vintage 5/1 ARM prepayment speeds
Note: 3.5% includes pools with 3.5%≤issuance coupon<4.0%, 4.0% includes pools with 4.0%≤issuance coupon<4.5%, and 4.5% includes pools with 4.5%≤issuance coupon<5.0%, Loans are indexed to LIBOR. Source: Fannie Mae, Freddie Mac, Santander US Capital Markets.
The exhibit also shows that prepayments spike as the first reset approaches. Many borrowers will refinance rather than allow the loan to reset higher. The right-hand exhibit shows that coupon increased at reset for the borrowers that did not refinance. Borrowers anticipating their loan will reset higher are likely to refinance into a new hybrid ARM or a fixed-rate loan to avoid future interest rate risk. A new hybrid might also have a teaser rate that is lower than the fully indexed rate of the existing loan. In this case the prepayment increase was largest for the higher coupon pools that faced the lowest reset risk but typically speeds increase more when the projected reset is higher. There is also a small spike as the second reset, at 72 months, approaches even though coupons will reset lower.
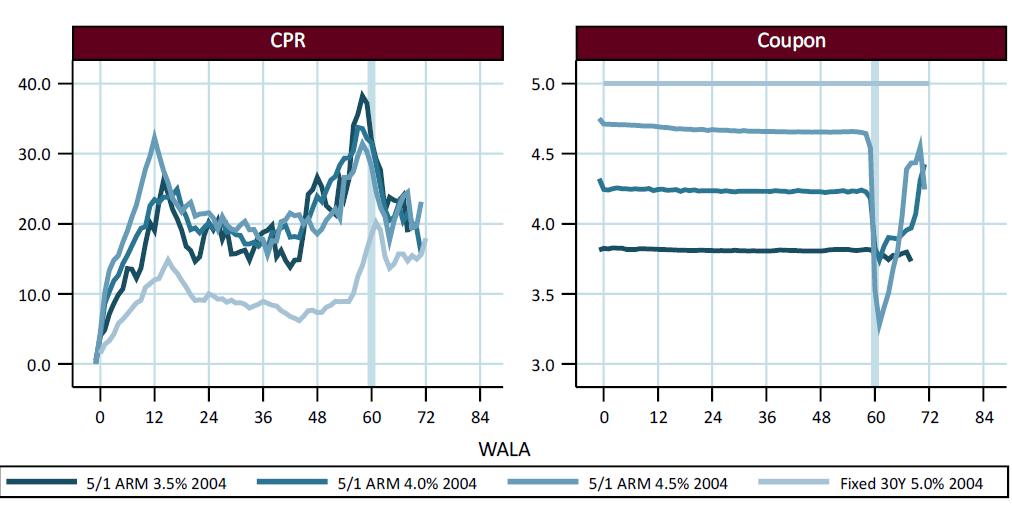
The same coupons from the 2004 vintage also exhibit a prepayment pickup prior to the first reset (Exhibit 7). But in this case, coupons reset lower, which is shown in the right-hand chart. The prepayment increase was muted compared to the 2003 vintage, but still present. Many borrowers still chose to avoid the reset and subsequent resets, even though they could have received a lower interest rate for free. This is a sign that many people want to avoid interest rate risk.
Exhibit 7: 2004 vintage 5/1 ARM prepayment speeds
Note: 3.5% includes pools with 3.5%≤issuance coupon<4.0%, 4.0% includes pools with 4.0%≤issuance coupon<4.5%, and 4.5% includes pools with 4.5%≤issuance coupon<5.0%, Loans are indexed to LIBOR. Source: Fannie Mae, Freddie Mac, Santander US Capital Markets.
The borrower’s choice of a hybrid ARM, and the type of hybrid ARM, is a strong signal of their future prepayment behavior. The typical borrower plans to prepay prior to the first reset. Some expect to move while others assume they will be able to refinance. Borrowers in shorter reset hybrids tend to prepay the fastest prior to the reset, because they are the most certain of their plans over the next few years.
The shape of the yield curve also matters. Hybrid ARM rates will be lower relative to fixed-rate loans when the curve is steep. Borrowers are more likely to refinance into a fixed-rate loan when the yield curve is flat. This can happen even if the new rate is higher than the existing rate because the borrower values the certainty of the fixed interest rate.
Cash flow valuation and relative value
Given the hybrid nature of ARMs, these bonds generally carry shorter durations and are less negatively convex than fixed-rate MBS with comparable coupons. ARM durations are generally shorter than fixed-rate MBS for a couple of reasons. Depending on prevailing benchmark rates, ARM prepayments can increase around the reset date as borrowers refinance into fixed-rate loans or another hybrid teaser rate, decreasing the tail balance of the post-reset cash flow. Additionally, while the floating-rate tail will incur some duration as a function of the initial, periodic and life caps, the tail will carry less duration than a comparable fixed-rate MBS.
Convexity, by and large, is better in ARMs than fixed-rate MBS simply because coupons reset with prevailing market rates, creating less refinancing incentive for borrowers. The embedded caps in the underlying ARM loans create convexity effects in that as the bond’s coupon approaches the cap, it begins to perform more like a fixed-rate MBS.
Spread and pricing conventions
Hybrid ARMs price to a zero-volatility cash flow spread, ballooning the remaining outstanding principal at the reset date, a pricing convention referred to as CPB, or Conditional Prepayment to Balloon. To determine the dollar price for an agency hybrid, the bond will be quoted to a nominal zero volatility spread assuming a speed of 15 CPB. Annual and post-reset hybrids do not have a standardized speed convention. Post-reset hybrids will generally be priced to higher assumed prepayment rates given potential borrower incentive to refinance into a fixed-rate or new hybrid teaser rate. Given the floating-rate nature of annual and post-reset hybrid ARMs, they are valued using a Discount Margin rather than a zero-volatility cash flow spread.
Tail valuations
The valuation framework for ARM pools differs from fixed-rate MBS in that investors need to value both the fixed and floating-rate components of the bond. Valuing the cash flow during the teaser period is a straightforward analysis as the fixed-rate portion of the cash flow is effectively a soft bullet that balloons at the reset date.
Valuing the tail is a more complex exercise. Like any capped floating-rate instrument, the shape of the forward curve and levels of implied and realized volatility will drive the value of the cap the floater is short. ARMs are somewhat unique in that the investor is short a series of caplets as a function of the initial and periodic caps. For example, a Ginnie Mae ARM with a 1/1/5 cap structure will be short a cap struck 100 bp over the teaser rate in the first year after the reset and then an incremental 100 bps higher over the next four years until the bond reaches its lifetime coupon cap.
Furthermore, valuing the floating-rate component of the cash flow requires investors to forecast both how much of the bond remains at the reset and the estimated price at which that floater will trade once the coupon begins to reset. Given the fact that ARM net margins are often substantially greater than stated and discount margins on floating-rate CMOs, these ARM ‘tails’ will often trade at a premium to par.
Pricing, total return and relative value considerations
From a total return perspective, ARM tails should offer better price convexity than CMO floaters into a rally. Despite both instruments increasing in value as the bond’s coupon moves further away from its cap, the fixed-rate collateral backing the CMO is, in most cases, incurring more prepayment risk as rates fall and refinancing incentive increases. Conversely, the WAC on the collateral backing the ARM bond will decrease with rates, limiting moneyness and refinancing incentive, depressing prepayment risk and improving price convexity.
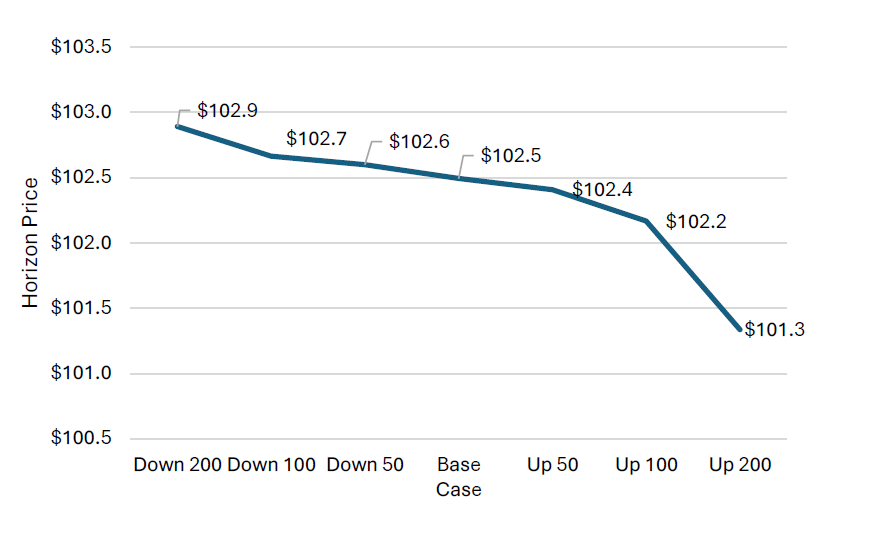
Embedded premiums in ARM tails can be distilled through a simplified analytical framework. Using a constant OAS methodology and solving for the price at the reset will show the projected value of the tail. Pricing a 1 WALA, 4.45% coupon, 5/6 conventional hybrid ARM at a current market price of $98-21 translates to an OAS of 43 bp. Holding that OAS constant and solving for a 5-year forward price implies tail values between $101.3 and $102.9 depending on the future path of interest rates (Exhibit 8). The tail exhibits strong price convexity into a rally, holding relatively constant versus the base case horizon price as the model estimates that prepayment risk will remain relatively constant as the underlying loans’ note rates reset lower, dampening refinancing incentive.
Exhibit 8: Forecasting tail values using a constant OAS methodology
Source: Santander US Capital Markets, YieldBook
With regards to relative value comparables, the fixed-rate portion of the hybrid can be compared to comparable coupon 15-year pass throughs, short CMO front sequentials and PACs, and five, seven and 10-year agency CMBS depending on the tenor of the teaser period as they should offer comparable cash flow, rate and spread duration to the fixed portion of the hybrid, albeit with varying convexity profiles. Annual and post-reset ARMs compare favorably to agency CMO and multifamily CMBS floaters, but investors must be adequately compensated for the series of caplets they are short relative to comparable exposures.