The Big Idea

Day to day, more about inflation than growth

| May 29, 2026

This material is a Marketing Communication and does not constitute Independent Investment Research.

The correlations between energy, US rates and risk markets have eased since the US and Iran went to war in March but remain higher than before the conflict. Before the war, the market responded more to shifting signs of growth. Now it’s more about inflation, but not as much as you might think.

Paying more attention to oil

The market definitely is paying more attention to oil since the outbreak of war. The implications for rates and risk assets are different, although the magnitude of impact across US assets is modest at best. Rates are filtering oil through its impact on inflation and the Fed while risk assets filter it through corporate earnings and credit. Daily changes in the price of Brent crude and rates along the yield curve tell one part of the story, and daily changes in Brent and risk spreads tell the other.

Oil and rates

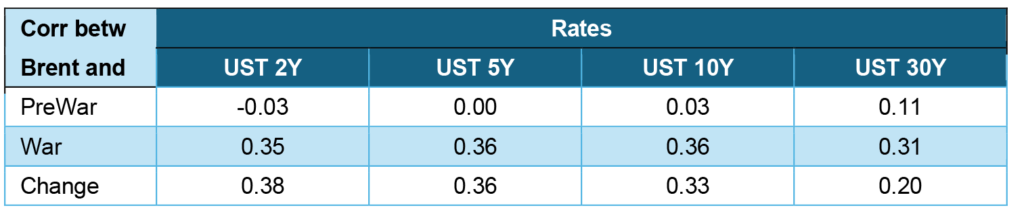
The tell for rates is the changing correlation between Brent and rates at different maturities. In the 90 days before war broke out, the correlation between Brent and rates all along the curve basically was zero (Exhibit 1). Although both Brent and rates can reflect changes in growth and inflation, the low correlations suggest influences unique to each market called the tune for almost all daily movement in pricing.

Exhibit 1: Changing correlations between Brent crude and rates
Note: PreWar spans 12/1/2025 to 2/27/2026 while War spans 2/28/2026 to 5/28/2026. Correlations are between daily changes. MBS, IG and HY OAS from Bloomberg market indices.
Source: Bloomberg, Santander US Capital Markets.

In the 90 days since the start of war, however, the correlation has jumped into the 0.30s across maturities, with the biggest jumps coming in the shortest maturities and declining further along the curve. That seems consistent with a market worried about inflation and the Fed’s response, especially in the near term. In other words, when oil goes up and raises concern about inflation and Fed hikes, rates go up and the yield curve flattens.

Caveats apply. The correlations between Brent and rates still top out at 0.36, meaning that only (0.36)2 or 13% of the daily changes in rates can be directly attributed to Brent and 87% of the changes come from something else.

Oil and risk assets

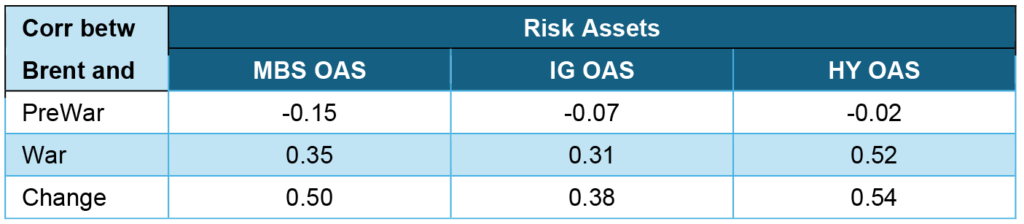
The tell for risk assets is the changing correlation between Brent and spreads, and especially between investment grade and high yield spreads (Exhibit 3). Before war broke out, Brent showed a very small negative correlation with spreads. A rise in Brent tended to come with tightening spreads, and a drop in Brent with widening. Oil and risk spreads tend to move in opposite directions in a market responding to growth, higher growth pushing up the price of oil, raising the prospects of better corporate earnings and tightening credit spreads with lower growth having the opposite effects.

Exhibit 2: Changing correlation between Brent crude and risk spreads
Note: PreWar spans 12/1/2025 to 2/27/2026 while War spans 2/28/2026 to 5/28/2026. Correlations are between daily changes. MBS, IG and HY OAS from Bloomberg market indices.
Source: Bloomberg, Santander US Capital Markets.

Since the outbreak of war, the correlation between Brent and risk spreads has become modestly positive, ranging from 0.31 for the correlation between Brent and the market’s investment grade index and 0.52 for the correlation between Brent and the high yield index. Now, when Brent rises, spreads widen. And when Brent falls, spreads tighten. This is consistent with a market concerned about inflation and the risk that it squeezes corporate earnings either through higher rates or through other higher input costs. The biggest jump in correlation has come in high yield, where sensitivity to cost of debt and other inputs is the highest.

Again, caveats. The correlations between Brent and risk spreads tops out at 0.52, meaning only (0.52)2 or 27% of the variance is explained at most. The other 73% or more comes from other effects.

Rates and risk assets

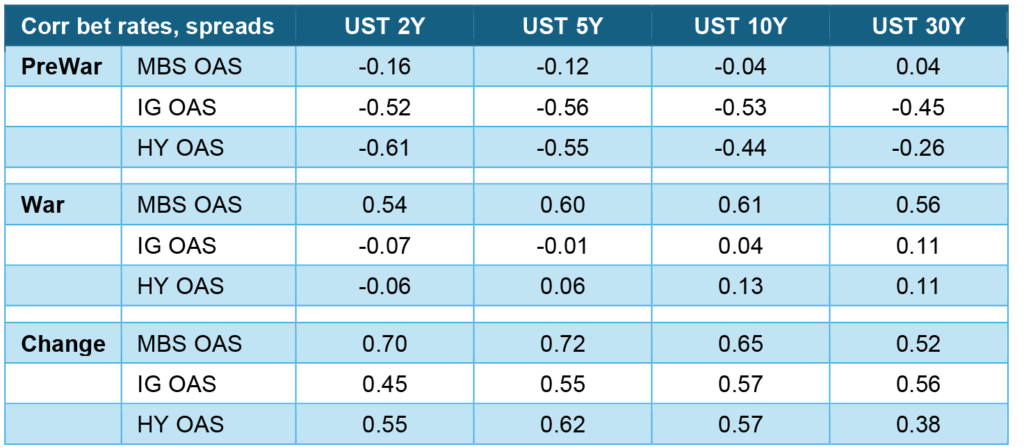
The shift in market focus from growth toward inflation also shows up in the changing correlations between rates and risk spreads. Before the war, rates and risk spreads tended to move in opposite directions. When rates went up, spreads tightened. And when rates went down, spreads widened.  That led to negative correlations characteristic of a market focused on growth (Exhibit 3).

Exhibit 3: Changing correlations between rates, risk spreads
Note: PreWar spans 12/1/2025 to 2/27/2026 while War spans 2/28/2026 to 5/28/2026. Correlations are between daily changes. MBS, IG and HY OAS from Bloomberg market indices.
Source: Bloomberg, Santander US Capital Markets.

Since the war started, those negative correlations have disappeared as inflation has become a bigger concern. The impact on MBS is especially pronounced—the correlation between 10-year rates and MBS OAS rising from -0.04 to 0.61— although a good theory for that is unclear. It is possible the market has become more sensitive to changing MBS convexity, although it is not clear why war or oil would trigger that.

Market implications

A modest portion of daily volatility in rates and spreads now depends on oil and its downstream impact on inflation and growth. That should affect relative value and risk calculations and hedge ratios, among other things. Given the stalemate between the US and Iran, this looks unlikely to change for months if not longer.

* * *

The view in rates

The very front end of the curve is probably stuck at a floor of 3.65% or higher depending on US-Iran and expected short-term inflation. The 10-year note continues to look like it will spend more time above 4.25% than below it for the balance of the year. It would take a credible ceasefire in the Middle East and concrete steps toward a lasting agreement between the US and Iran for 10-year yields to drop below 4.25%.

Key market levels:

  • Setting on 3-month term SOFR traded Friday at 366 bp, nearly unchanged for 12 weeks.
  • Further out the curve, the 2-year note traded Friday at 4.00, down 7 bp over two weeks. The 10-year note traded at 4.43%, down 16 bp.
  • The Treasury yield curve traded Friday with 2s10s at 43 bp, flatter by 9 bp over the last two weeks, with 5s30s at 83 bp, flatter by 3 bp
  • Breakeven 10-year inflation traded Friday at 240 bp, down 11 bp over the last two weeks, with 5-year forward 5-year breakeven at 223 bp, down 3 bp and still signaling confidence that the Fed target still holds. The 10-year real rate finished the week at 203 bp, down 3 bp over the last two weeks.

The view in spreads

The supply and demand balance looks constructive for MBS and a little less so for corporate debt. MBS net supply continues to run very low while Fannie Mae and Freddie Mac continue to add to their mortgage portfolios. Insurers continue to issue annuities and buy corporate and structured credit, but credit is facing significant needs to finance the current AI buildout. MBS spreads should be able to hold their ground in most circumstances, but credit spreads look soft depending on the volume of net issuance.

The Bloomberg US investment grade corporate bond index OAS traded on Friday at 72 bp, tighter by 2 bp in the last two weeks. Nominal par 30-year MBS spreads to the blend of 5- and 10-year Treasury yields traded Friday at 109 bp, tighter by 6 bp in the last two weeks. Par 30-year MBS TOAS closed Friday at 20 bp, tighter by 1 bp in the last two weeks.

The view in credit

Haves and have nots continue. Big companies have healthier balance sheets than smaller companies. Consumers at the middle-to-higher end of the income distribution also have liquidity and wealth. Bank lending to non-bank financial institutions, including private debt funds and business development companies continues to expand. Bank regulators continue to focus on that category of lending, which could eventually tighten the private credit markets. But for now, credit metrics for NBFI lending are strong relative to traditional bank lending such as C&I.

Steven Abrahams
steven.abrahams@santander.us
1 (646) 776-7864

This material is intended only for institutional investors and does not carry all of the independence and disclosure standards of retail debt research reports. In the preparation of this material, the author may have consulted or otherwise discussed the matters referenced herein with one or more of SCM’s trading desks, any of which may have accumulated or otherwise taken a position, long or short, in any of the financial instruments discussed in or related to this material. Further, SCM may act as a market maker or principal dealer and may have proprietary interests that differ or conflict with the recipient hereof, in connection with any financial instrument discussed in or related to this material.

This message, including any attachments or links contained herein, is subject to important disclaimers, conditions, and disclosures regarding Electronic Communications, which you can find at https://portfolio-strategy.apsec.com/sancap-disclaimers-and-disclosures.

Important Disclaimers

Copyright © 2026 Santander US Capital Markets LLC and its affiliates (“SCM”). All rights reserved. SCM is a member of FINRA and SIPC. This material is intended for limited distribution to institutions only and is not publicly available. Any unauthorized use or disclosure is prohibited.

In making this material available, SCM (i) is not providing any advice to the recipient, including, without limitation, any advice as to investment, legal, accounting, tax and financial matters, (ii) is not acting as an advisor or fiduciary in respect of the recipient, (iii) is not making any predictions or projections and (iv) intends that any recipient to which SCM has provided this material is an “institutional investor” (as defined under applicable law and regulation, including FINRA Rule 4512 and that this material will not be disseminated, in whole or part, to any third party by the recipient.

The author of this material is an economist, desk strategist or trader. In the preparation of this material, the author may have consulted or otherwise discussed the matters referenced herein with one or more of SCM’s trading desks, any of which may have accumulated or otherwise taken a position, long or short, in any of the financial instruments discussed in or related to this material. Further, SCM or any of its affiliates may act as a market maker or principal dealer and may have proprietary interests that differ or conflict with the recipient hereof, in connection with any financial instrument discussed in or related to this material.

This material (i) has been prepared for information purposes only and does not constitute a solicitation or an offer to buy or sell any securities, related investments or other financial instruments, (ii) is neither research, a “research report” as commonly understood under the securities laws and regulations promulgated thereunder nor the product of a research department, (iii) or parts thereof may have been obtained from various sources, the reliability of which has not been verified and cannot be guaranteed by SCM, (iv) should not be reproduced or disclosed to any other person, without SCM’s prior consent and (v) is not intended for distribution in any jurisdiction in which its distribution would be prohibited.

In connection with this material, SCM (i) makes no representation or warranties as to the appropriateness or reliance for use in any transaction or as to the permissibility or legality of any financial instrument in any jurisdiction, (ii) believes the information in this material to be reliable, has not independently verified such information and makes no representation, express or implied, with regard to the accuracy or completeness of such information, (iii) accepts no responsibility or liability as to any reliance placed, or investment decision made, on the basis of such information by the recipient and (iv) does not undertake, and disclaims any duty to undertake, to update or to revise the information contained in this material.

Unless otherwise stated, the views, opinions, forecasts, valuations, or estimates contained in this material are those solely of the author, as of the date of publication of this material, and are subject to change without notice. The recipient of this material should make an independent evaluation of this information and make such other investigations as the recipient considers necessary (including obtaining independent financial advice), before transacting in any financial market or instrument discussed in or related to this material.

Important disclaimers for clients in the EU and UK

This publication has been prepared by Trading Desk Strategists within the Sales and Trading functions of Santander US Capital Markets LLC (“SanCap”), the US registered broker-dealer of Santander Corporate & Investment Banking. This communication is distributed in the EEA by Banco Santander S.A., a credit institution registered in Spain and authorised and regulated by the Bank of Spain and the CNMV. Any EEA recipient of this communication that would like to affect any transaction in any security or issuer discussed herein should do so with Banco Santander S.A. or any of its affiliates (together “Santander”). This communication has been distributed in the UK by Banco Santander, S.A.’s London branch, authorised by the Bank of Spain and subject to regulatory oversight on certain matters by the Financial Conduct Authority (FCA) and the Prudential Regulation Authority (PRA).

The publication is intended for exclusive use for Professional Clients and Eligible Counterparties as defined by MiFID II and is not intended for use by retail customers or for any persons or entities in any jurisdictions or country where such distribution or use would be contrary to local law or regulation.

This material is not a product of Santander´s Research Team and does not constitute independent investment research. This is a marketing communication and may contain ¨investment recommendations¨ as defined by the Market Abuse Regulation 596/2014 ("MAR"). This publication has not been prepared in accordance with legal requirements designed to promote the independence of research and is not subject to any prohibition on dealing ahead of the dissemination of investment research. The author, date and time of the production of this publication are as indicated herein.

This publication does not constitute investment advice and may not be relied upon to form an investment decision, nor should it be construed as any offer to sell or issue or invitation to purchase, acquire or subscribe for any instruments referred herein. The publication has been prepared in good faith and based on information Santander considers reliable as of the date of publication, but Santander does not guarantee or represent, express or implied, that such information is accurate or complete. All estimates, forecasts and opinions are current as at the date of this publication and are subject to change without notice. Unless otherwise indicated, Santander does not intend to update this publication. The views and commentary in this publication may not be objective or independent of the interests of the Trading and Sales functions of Santander, who may be active participants in the markets, investments or strategies referred to herein and/or may receive compensation from investment banking and non-investment banking services from entities mentioned herein. Santander may trade as principal, make a market or hold positions in instruments (or related derivatives) and/or hold financial interest in entities discussed herein. Santander may provide market commentary or trading strategies to other clients or engage in transactions which may differ from views expressed herein. Santander may have acted upon the contents of this publication prior to you having received it.

This publication is intended for the exclusive use of the recipient and must not be reproduced, redistributed or transmitted, in whole or in part, without Santander’s consent. The recipient agrees to keep confidential at all times information contained herein.

The Library

Search Articles