


The Big Idea
Trimmed-mean inflation may pack a surprise for Warsh
Stephen Stanley | May 15, 2026
This material is a Marketing Communication and does not constitute Independent Investment Research.
At his confirmation hearing, Kevin Warsh noted that “the data that’s being used to judge inflation is quite imperfect.” He went on to express a preference for “trimmed averages,” or trimmed-mean gauges, as a superior indicator of underlying inflation. Trimmed-mean calculations, Warsh said, point to a “somewhat improving” and “quite favorable” inflation picture. While his characterization is correct, there are reasons to worry that details of the current inflation landscape may be distorting the trimmed-mean calculations along with other more traditional measures.
Inflation aggregates
The inflation picture is complicated at the moment. Price hikes are being boosted to an uncertain degree by tariff-related passthrough. More recently, the energy price shock has led to a spike in energy costs and is already beginning to bleed more widely into prices. As a result, headline and core inflation measures have been accelerating so far this year. A substantial portion of the deterioration can be pinned on temporary factors, and Fed officials’ views vary on how easily these factors can be dismissed. More hawkish policymakers worry that the series of supposed one-off factors boosting inflation could lead businesses and consumers to change their attitudes regarding the price outlook, raising inflation expectations and in turn greasing the skids for a pickup in the underlying trend.
Another complication has been the distortions in the CPI caused by the absence of an October survey. As detailed recently, this depressed the measure of shelter costs through March, followed by what are likely to be somewhat inflated readings from April through September. This phenomenon also affects the PCE deflator (because the CPI measures of rent and owners’ equivalent rent pass directly through to the PCE deflator), though with much smaller weights.
In any case, while the year-over-year advance in the core CPI has been distorted downward by technical issues, the core PCE deflator has been ascending. Over the last four months, from December through March, the core PCE deflator has risen on a monthly basis by 0.33%, 0.42%, 0.37%, and 0.29%, adding up to a 4.3% annualized pace. Meanwhile, over that period, the year-over-year advance for the core PCE deflator has accelerated from 2.8% to 3.2%, the highest reading since 2023.
Trimmed-mean inflation
As a refresher, trimmed-mean gauges represent a different way to get to underlying inflation. Economists’ first pass at getting to a more accurate read on trend inflation, developed in the 1970s, was to strip out food and energy prices because they were noisy. However, always excluding the same subset of items seems arbitrary.
The trimmed-mean concept that new Fed Chair Warsh prefers offers an alternative approach. Rather than excluding the same line items every month, as the core does, a trimmed-mean gauge ranks all the categories from biggest increase to largest decline and then lops off the extremes. The idea is that this will eliminate all of the special factors that are pushing inflation higher or lower, leaving a cleaner read of the underlying trend.
The most prominent trimmed-mean PCE deflator gauge is published by the Dallas Fed. The calculation is based on the weights of the components. First, the line items are ranked from highest to lowest. Then, based on their category weights, the top 31% of the index and the bottom 24% of the index are trimmed out, leaving just under half of the weight of the index. The number of items that get excluded would vary from one month to the next, depending on the weights of the outliers. For example, there could be dozens of items stripped out on either extreme if their weights are small or only a handful if their weights are large.
In general, I wholeheartedly agree with Warsh’s glowing assessment of trimmed mean measures. In fact, I have written a number of pieces over the years highlighting trimmed mean gauges of inflation. I would also agree with Warsh’s description of what the Dallas Fed trimmed mean gauge shows. While the year-over-year advance in the core PCE deflator has jumped, the trimmed mean year-over-year increase trended lower through much of 2025 and has been relatively steady, fluctuating between 2.3% and 2.5%, since October (Exhibit 1). The six-month annualized increase for the Dallas Fed gauge looks even better, at 2.2% in March and fluctuating between 2.0% and 2.2% since December.
Exhibit 1: Year-over-year inflation measures
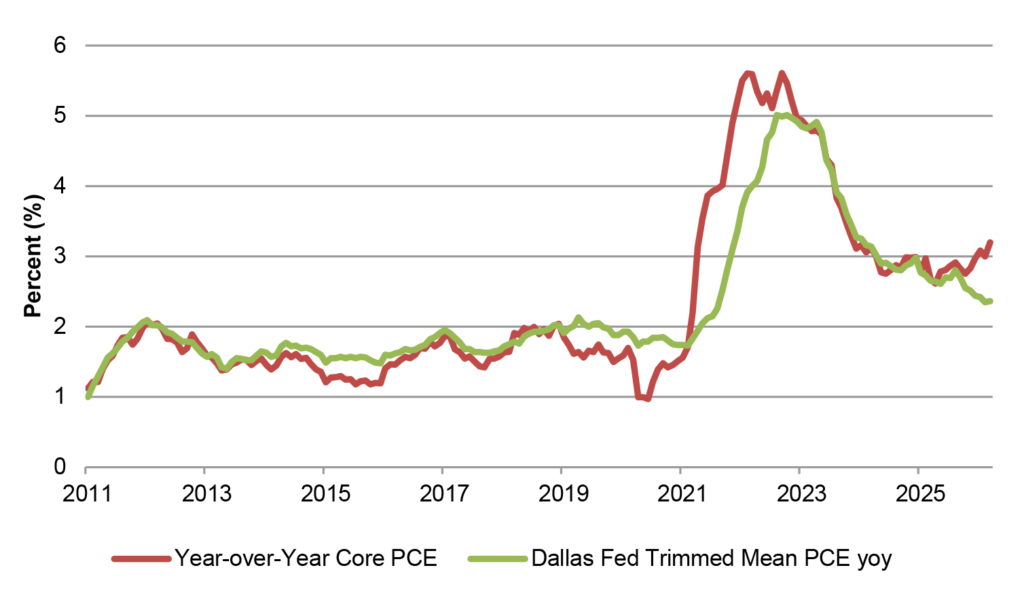
Source: BEA, Dallas Fed.
However, in the current instance, I see two reasons to be cautious about getting overly excited about the performance of the Dallas Fed gauge. First, the direct effects of both tariffs and the energy price shock are being erased from the calculation by the trimming of extremes, but the second-round impacts are yet to be felt. In the case of tariffs, for example, sharply higher prices for steel and aluminum are being felt across the manufacturing sector and are likely to lead to a broader round of price hikes going forward. Similarly, as transportation costs surge—trucking freight rates spiked by 8.1% in April in the PPI—firms will likely be forced to raise their goods prices.
There is precedent for this. When core inflation began to gallop higher in 2021, the Dallas Fed trimmed-mean alternative lagged behind, opening up a gap of nearly two percentage points. In 2022, it was the Dallas Fed trimmed mean index that converged to the core PCE deflator, rather than the opposite, as has historically been the case. While the core PCE deflator year-over-year advance ended 2022 at 5.0%, down slightly from the December 2021 reading of 5.2%, the Dallas Fed trimmed mean gauge accelerated sharply over the course of 2022, from 3.4% in December 2021 to 4.9% by the end of 2022. In my view, this reflected the diffusion of the supply side disruptions during and just after the pandemic to an increasing portion of the economy. Similarly, the current energy price shock, which may ultimately prove “transitory,” is not widely touching the economy just yet, mainly limited to energy products and a handful of other categories, such as airfares. All of those line items are being excluded from the trimmed mean gauge at the moment. Nonetheless, as transportation costs are passed through to a variety of goods categories, most notably food, the fallout from the spike in energy costs will dominate more and more of the upper tail of the ranking. As outsized price increases become more common, categories that were previously in the upper tail will fall into the middle 45% and will likely drive the trimmed mean calculation higher, as occurred in 2022.
Second, the downward distortion to shelter costs caused by the lack of an October CPI survey is having a major impact on the Dallas Fed trimmed-mean gauge. Rent and OER are almost always going to be in the middle 45% of the rankings, as they rarely post outsized gains or declines. So, if they are artificially depressed, they will drive down the trimmed mean figures. These two components have much smaller weights in the PCE deflator than in the CPI, but they are still quite large, accounting for a combined 15% of the PCE deflator. If they are in the middle 45%, as they almost always are, they represent one-third of the trimmed mean index. Consider what the acceleration in these two items in the April CPI will mean for the trimmed-mean gauge. Rent and OER went from one-month annualized rises of 2.3% and 3.5%, respectively, in March to 6.8% and 6.5%, respectively, in April. That might actually push one or both of them into the top 31% for April (in March, the cutoff was 5.3% annualized), nudging a number of high inflation line items from the upper tail down into the middle 45%. Alternatively, if rent and OER remain in the middle 45% of the stack, the one-month annualized Dallas Fed calculation would be pushed up by over a full percentage point just by the shelter cost pickup. If everything else were equal, that alone would boost the one-month calculation from 2.9% in March to 4% in April.
It will, of course, take a while for the marginal pickup in shelter costs to make a serious difference for the 12-month advance, but if shelter costs remain somewhat inflated over the next five months, the mirror image of the October-to-March downward distortion, then the Dallas Fed trimmed mean gauge will see a far larger impact than the core PCE deflator. This is because shelter costs represent about one-third of the Dallas Fed trimmed mean calculation but only about one-sixth of the core PCE deflator (the core PCE deflator is about 90% of the total PCE deflator, double the Dallas Fed’s 45%).
Conclusion
As Kevin Warsh takes the head seat at the FOMC boardroom table, he may continue to argue that the inflation picture is far less troubling than the traditional total and core aggregates suggest by citing the Dallas Fed trimmed-mean gauge, which has been running considerably lower than the core PCE deflator in recent months. However, he may be in for an ugly surprise over the next six months, as higher energy costs bleed into the broader economy and the downward distortion on shelter costs reverses. The trimmed-mean gauge appears poised to accelerate substantially over the next several months. Warsh and the Fed would be well-served to continue to give serious consideration to this measure over time, but at the moment, it may be offering false hope for the inflation picture.