By the Numbers
Home prices rise in March, but some big cities appear challenged
This material is a Marketing Communication and does not constitute Independent Investment Research.
After a fairly stagnant first two months of the year, median sales prices jumped 2% year-over-year in March, according to Redfin. But the broad-based increase in home prices likely should not be construed as a sign of strength across markets. Market technicals in some of the largest cities including New York, Los Angeles and Chicago are currently strong but appear poised to weaken. Conversely, Sun Belt MSAs that have experienced a downturn, look to be stabilizing and in some cases, improving.
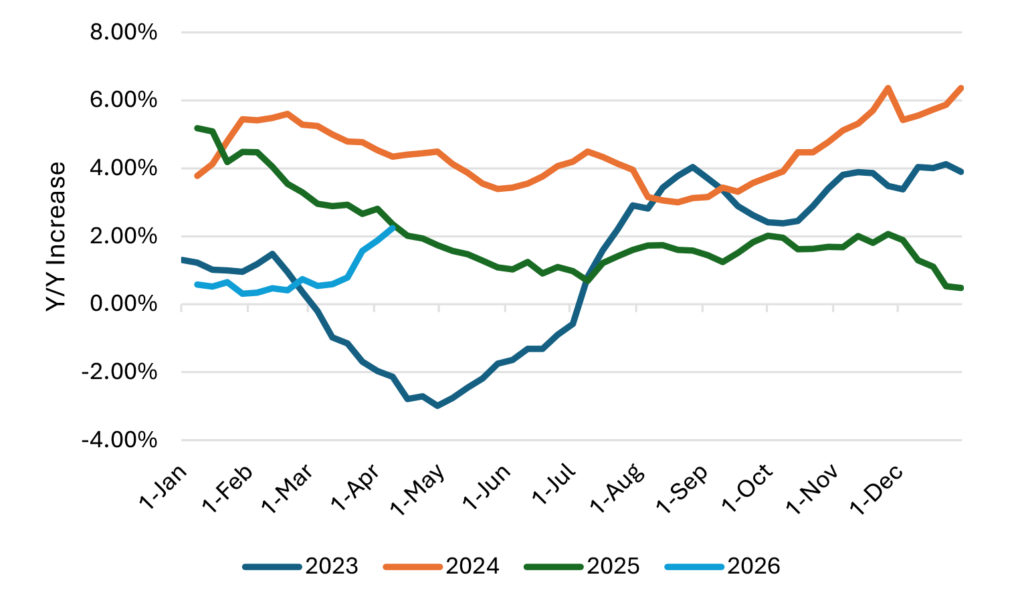
The average sale price of homes sold last month across all MSAs tracked by Redfin rose from $384,000 in March of last year to $393,000, representing a 2.3% year-over-year increase (Exhibit 1). Sales prices rose in excess of 2.0% despite median asking prices increasing by just over 1.5% over the same period, illustrating a taut supply technical in certain areas as buyers are forced to pay over asking prices in certain markets. And that supply technical looks likely to remain in place in the near term, as new listings are down roughly 2.5% versus last year. The average amount of time homes remained on market fell sharply in March as well, declining from an average of 58 days in February to just 51 days last month, driven to some degree by the start of the spring buying season.
Exhibit 1: Home prices rise in March after a slow start to the year
Source: Santander US Capital Markets, Redfin
National trends are strong but regional trends remain mixed
While headline numbers are strong, it appears they are masking a much more mixed picture at the MSA level. Only a handful of markets are flashing consistently strong metrics, marked by positive market momentum and seller strength. Large cities like New York, Los Angeles, Chicago, Boston and Washington DC maintain strong current market conditions but appear poised to soften. Certain areas, particularly the Sun Belt, appear to be stabilizing and improving after previously experiencing varying degrees of stress.
Currently strong markets include tech hubs of San Francisco and San Jose, along with metro-adjacent MSAs including Newark, Hartford and Lake County, IL. These MSAs are all marked by fairly tight inventories. Both San Francisco and San Jose have roughly two moths of supply on market and homes are selling between five to ten points over asking prices. These areas remain strong despite being extremely unaffordable based on traditional metrics. At a median price of just over $1.5 million, homes in San Francisco are clearing at values which represent roughly 1150% of the median income where the estimated monthly mortgage payment would represent more than 70% of median monthly income. This imbalance is even more pronounced in San Jose where the median home sale equates to roughly 1650% of median income where the monthly payment is in excess of 100% of monthly income. These numbers suggest a significant Gini coefficient, where a substantial skew in income distribution can support elevated valuations in the presence of a limited supply of homes.
Supply, slowing sales signal weakening trends in big cities
Home prices in New York, Los Angeles, Chicago, Boston and Washington DC all appear poised to soften. Los Angeles and New York carry severely challenged affordability, with median sales prices representing roughly 1100% and 900% of median income respectively. Unlike the tech hubs of San Francisco and San Jose, both New York and LA have seen a substantial downturn in both year-over-year and pending home sales. Year-over-year home sales have fallen by 7.6% and 6.5% respectively in LA and New York, while pending home sales have dipped by 6.7% and 9.8%. Supply metrics in Chicago, Boston and Washington DC are modestly better, with inventories ranging between three and four months. However, the pace of sales in both Chicago and Boston has slowed markedly, declining by roughly 9% year-over-year in both MSAs. All three cities have seen substantial amounts of inventory experience price reductions, ranging from 14% to 16.5% of listings seeing a price cut.
Signs of improvement in the Sun Belt
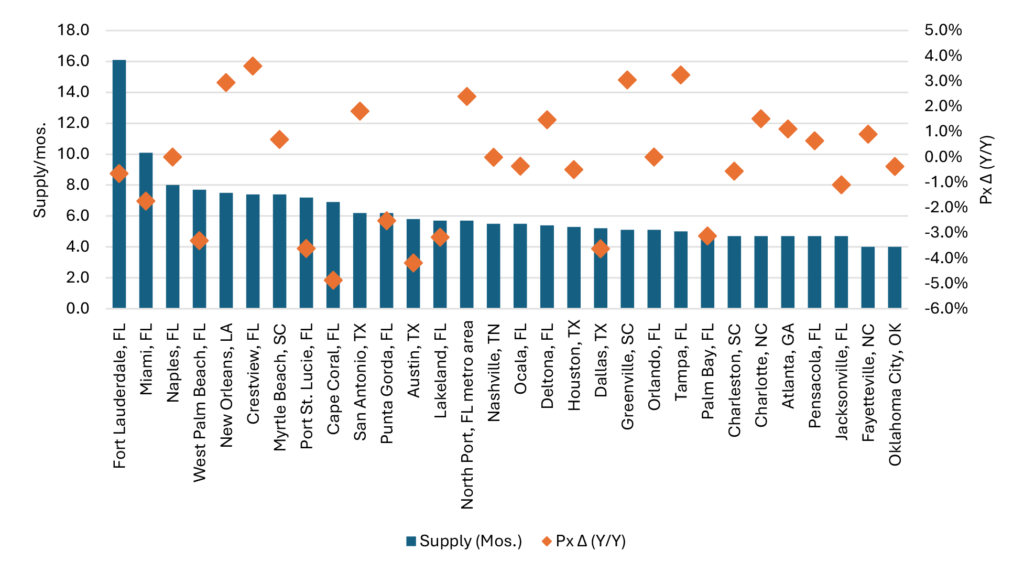
Certain Sun Belt MSAs have been marked by flattening or falling home values, attributable to rising inventories and increased non-fixed cost of home ownership as taxes and homeowner’s insurance have both increased both rapidly and meaningfully. However, there are datapoints that suggest that the Sun Belt looks to be stabilizing and even improving in some areas. While year-over-year home prices in major cities such as Miami and Fort Lauderdale are down slightly, prices in major MSAs on the west coast of the state have remained unchanged or risen slightly. Home prices in Tampa have risen by slightly more than 3% annually and prices in Naples, FL are unchanged. The biggest impediment to price increases is the large swath of inventory on market in many Sun Belt cities. Fort Lauderdale maintains by far the biggest supply overhang, with inventory currently sitting at 16 months (Exhibit 2).
Exhibit 2: Supply weighs on prices in Sun Belt MSAs
Source: Santander US Capital Markets, Redfin
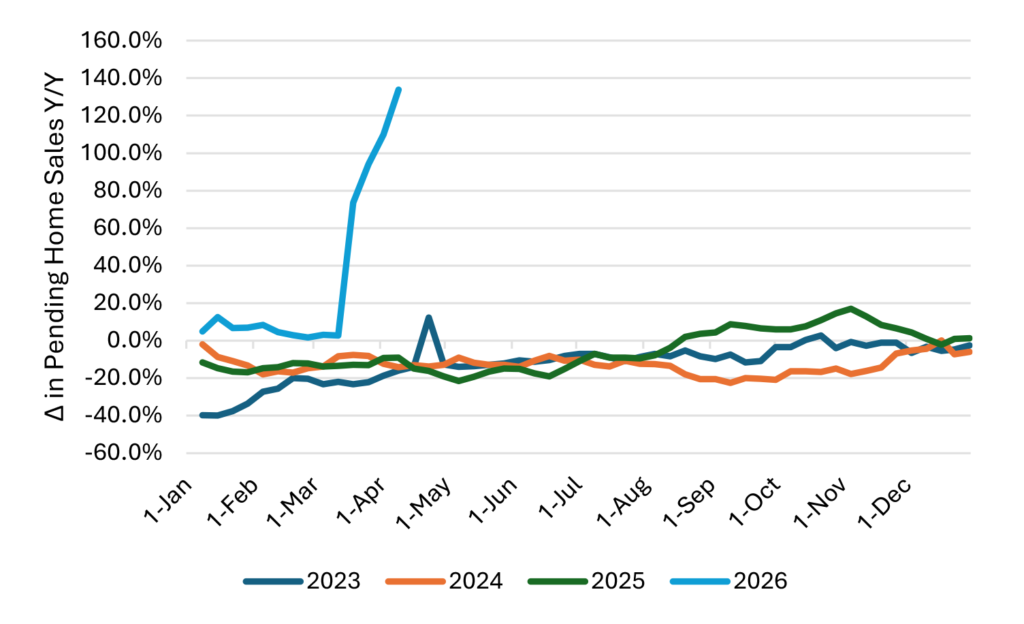
A closer look into specific markets suggests that fundamentals in the Sun Belt may being improving. Looking at the Fort Lauderdale market specifically shows that pending sales have risen to unprecedented levels relative to the past few years. Absent a brief period in the second half of last year, pending home sales have been persistently negative on a annualized basis but have risen rapidly in recent months, suggesting at least for the near term, that specific market may have found firmer footing (Exhibit 3).
Exhibit 3: Pending home sales spike in Fort Lauderdale
Source: Santander US Capital Markets, Redfin
Based on Redfin estimates as of February, migration trends appear constructive for home values in Florida and Arizona, and less so for New York, California and Illinois. Based on these estimates, net outflow searches in California totaled more than 36,000 people while more than 25,000 people were looking to leave New York on a net basis. Conversely, net inflow inquiries to Florida exceeded 23,000 people. Of the top 10 areas people have moved to over the past three months, Sacramento did see the largest inflow, but Florida had four cities in the top 10. Cities like Cape Coral and Jacksonville, which have seen prices soften, may be becoming more attractive options for those looking to relocate as they saw net inflows of 4,200 and 3,000 people respectively over the past three months.
This material is intended only for institutional investors and does not carry all of the independence and disclosure standards of retail debt research reports. In the preparation of this material, the author may have consulted or otherwise discussed the matters referenced herein with one or more of SCM’s trading desks, any of which may have accumulated or otherwise taken a position, long or short, in any of the financial instruments discussed in or related to this material. Further, SCM may act as a market maker or principal dealer and may have proprietary interests that differ or conflict with the recipient hereof, in connection with any financial instrument discussed in or related to this material.
This message, including any attachments or links contained herein, is subject to important disclaimers, conditions, and disclosures regarding Electronic Communications, which you can find at https://portfolio-strategy.apsec.com/sancap-disclaimers-and-disclosures.
Important Disclaimers
Copyright © 2026 Santander US Capital Markets LLC and its affiliates (“SCM”). All rights reserved. SCM is a member of FINRA and SIPC. This material is intended for limited distribution to institutions only and is not publicly available. Any unauthorized use or disclosure is prohibited.
In making this material available, SCM (i) is not providing any advice to the recipient, including, without limitation, any advice as to investment, legal, accounting, tax and financial matters, (ii) is not acting as an advisor or fiduciary in respect of the recipient, (iii) is not making any predictions or projections and (iv) intends that any recipient to which SCM has provided this material is an “institutional investor” (as defined under applicable law and regulation, including FINRA Rule 4512 and that this material will not be disseminated, in whole or part, to any third party by the recipient.
The author of this material is an economist, desk strategist or trader. In the preparation of this material, the author may have consulted or otherwise discussed the matters referenced herein with one or more of SCM’s trading desks, any of which may have accumulated or otherwise taken a position, long or short, in any of the financial instruments discussed in or related to this material. Further, SCM or any of its affiliates may act as a market maker or principal dealer and may have proprietary interests that differ or conflict with the recipient hereof, in connection with any financial instrument discussed in or related to this material.
This material (i) has been prepared for information purposes only and does not constitute a solicitation or an offer to buy or sell any securities, related investments or other financial instruments, (ii) is neither research, a “research report” as commonly understood under the securities laws and regulations promulgated thereunder nor the product of a research department, (iii) or parts thereof may have been obtained from various sources, the reliability of which has not been verified and cannot be guaranteed by SCM, (iv) should not be reproduced or disclosed to any other person, without SCM’s prior consent and (v) is not intended for distribution in any jurisdiction in which its distribution would be prohibited.
In connection with this material, SCM (i) makes no representation or warranties as to the appropriateness or reliance for use in any transaction or as to the permissibility or legality of any financial instrument in any jurisdiction, (ii) believes the information in this material to be reliable, has not independently verified such information and makes no representation, express or implied, with regard to the accuracy or completeness of such information, (iii) accepts no responsibility or liability as to any reliance placed, or investment decision made, on the basis of such information by the recipient and (iv) does not undertake, and disclaims any duty to undertake, to update or to revise the information contained in this material.
Unless otherwise stated, the views, opinions, forecasts, valuations, or estimates contained in this material are those solely of the author, as of the date of publication of this material, and are subject to change without notice. The recipient of this material should make an independent evaluation of this information and make such other investigations as the recipient considers necessary (including obtaining independent financial advice), before transacting in any financial market or instrument discussed in or related to this material.
Important disclaimers for clients in the EU and UK
This publication has been prepared by Trading Desk Strategists within the Sales and Trading functions of Santander US Capital Markets LLC (“SanCap”), the US registered broker-dealer of Santander Corporate & Investment Banking. This communication is distributed in the EEA by Banco Santander S.A., a credit institution registered in Spain and authorised and regulated by the Bank of Spain and the CNMV. Any EEA recipient of this communication that would like to affect any transaction in any security or issuer discussed herein should do so with Banco Santander S.A. or any of its affiliates (together “Santander”). This communication has been distributed in the UK by Banco Santander, S.A.’s London branch, authorised by the Bank of Spain and subject to regulatory oversight on certain matters by the Financial Conduct Authority (FCA) and the Prudential Regulation Authority (PRA).
The publication is intended for exclusive use for Professional Clients and Eligible Counterparties as defined by MiFID II and is not intended for use by retail customers or for any persons or entities in any jurisdictions or country where such distribution or use would be contrary to local law or regulation.
This material is not a product of Santander´s Research Team and does not constitute independent investment research. This is a marketing communication and may contain ¨investment recommendations¨ as defined by the Market Abuse Regulation 596/2014 ("MAR"). This publication has not been prepared in accordance with legal requirements designed to promote the independence of research and is not subject to any prohibition on dealing ahead of the dissemination of investment research. The author, date and time of the production of this publication are as indicated herein.
This publication does not constitute investment advice and may not be relied upon to form an investment decision, nor should it be construed as any offer to sell or issue or invitation to purchase, acquire or subscribe for any instruments referred herein. The publication has been prepared in good faith and based on information Santander considers reliable as of the date of publication, but Santander does not guarantee or represent, express or implied, that such information is accurate or complete. All estimates, forecasts and opinions are current as at the date of this publication and are subject to change without notice. Unless otherwise indicated, Santander does not intend to update this publication. The views and commentary in this publication may not be objective or independent of the interests of the Trading and Sales functions of Santander, who may be active participants in the markets, investments or strategies referred to herein and/or may receive compensation from investment banking and non-investment banking services from entities mentioned herein. Santander may trade as principal, make a market or hold positions in instruments (or related derivatives) and/or hold financial interest in entities discussed herein. Santander may provide market commentary or trading strategies to other clients or engage in transactions which may differ from views expressed herein. Santander may have acted upon the contents of this publication prior to you having received it.
This publication is intended for the exclusive use of the recipient and must not be reproduced, redistributed or transmitted, in whole or in part, without Santander’s consent. The recipient agrees to keep confidential at all times information contained herein.