The Big Idea
The sudden rising correlation of asset returns
This material is a Marketing Communication and does not constitute Independent Investment Research.
If you thought diversification would steady your portfolio in a market like the one we have had in March, then think again. Equities, rates, credit and volatility have increasingly become part of one big risk-on-risk-off trade, much more highly correlated since the start of the US-Iran war. Almost no matter what you hold, it is getting pulled into a war portfolio. The only refuge may be cash.
Equities and rates, rates and credit
Start with the relationship between equities and rates. Before the war—at least during markets in the fourth quarter of 2025—daily changes in the S&P 500 and in US 10-year Treasury rates correlated at a modest 0.17 (Exhibit 1). When the S&P went up, 10-year rates loosely tended to go up, too. A stronger economy would argue for higher equity prices and higher interest rates. Equities and rates showed a lot of independence in the innocent days of late 2025. But war has turned the tables. The correlation has gone to -0.61, indicating that a rise in the S&P comes with a drop in 10-year rates, and a drop in the S&P comes with a rise in 10-year rates. War—or perhaps more accurately fluctuating concerns about stagflation—is prompting both equity and debt prices increasingly to rise or fall together rather than show at least modest independence. Stagflation hurts both equity and debt. Risk on more and more days is either on or off, with fewer other things banging prices around.
Exhibit 1: War has flipped correlations between daily asset returns
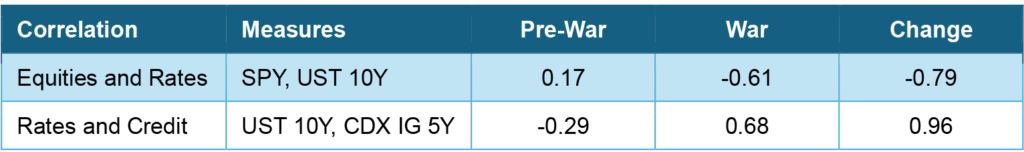
Notes: Correlation reflects the pairwise correlation between daily changes in the indicated measures. Pre-War correlation reflects data from 9/26/25 to 12/26/25. War correlation reflects data from 2/27/26 to 3/25/26.
Source: Bloomberg, Santander US Capital Markets.
Then look at the relationship between rates and credit. Before the war, daily changes in US 10-year yields and the CDX IG 5-year credit default swap correlated at a modest -0.29. When rates went up, spreads went down. That arguably reflected a world where indications of stronger growth looked a little negative for rates and positive for credit. But with war, the correlation has flipped to a stronger 0.68. Now a move higher in rates increasingly comes with a move wider in spreads. This arguably also reflects a world concerned about stagflation—bad for both rates and credit.
Widening the asset lens
The rising correlation between asset returns also shows up in a wider picture of the market, one that pulls in measures of equities, rates, credit and volatility. This one looks at the correlation of daily changes in the S&P 500, the NASDAQ 100, the OAS on the Bloomberg investment grade and high yield indices, spreads on the 5-year investment grade and high yield index credit default swaps, 10-year Treasury and SOFR rates, the 30-year MBS par coupon, and the MOVE and VIX option indices.
A look at all the correlations between these instruments in late 2025 and again in March would tell the detailed story or rising correlation, but a simpler approach looks for the few factors that link daily movements across these instruments—a principal components analysis. The most telling result from a PCA would be the amount of daily variation explained by the first and largest factor, arguably the risk-on-risk-off factor. This first factor in March accounted for 63.5% of variance while in late 2025 it accounted for 53% (Exhibit 2). An additional 10.5% of all movement in these instruments is now due to broad risk sentiment.
Exhibit 2: A rising share of market variance explained by risk-on-risk-off
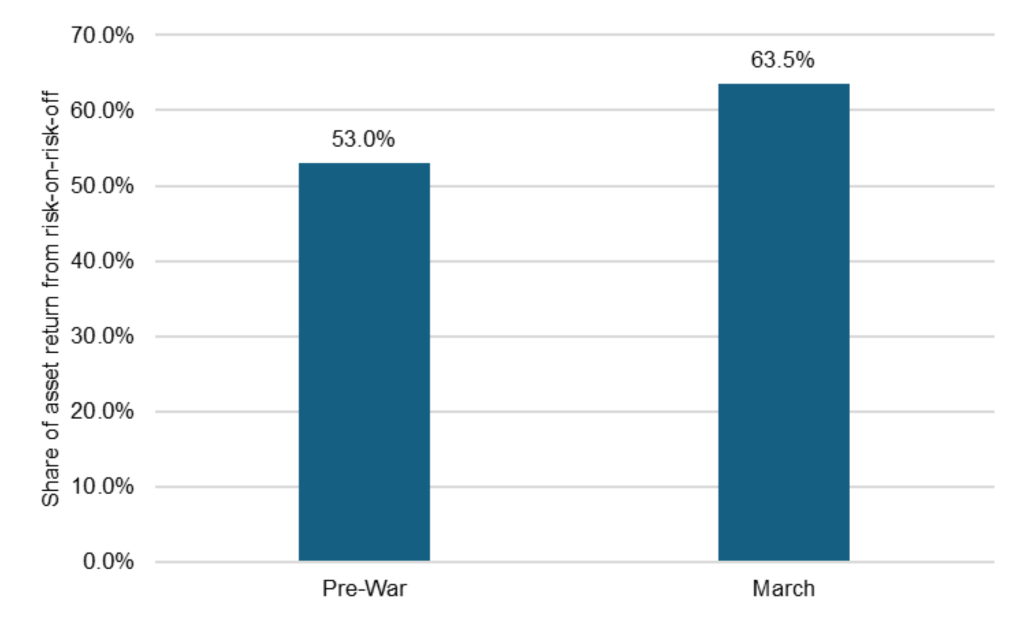
Notes: Variance explained by the first principal component of the correlation matrix of daily changes in the S&P 500, NASDAQ 100, the OAS on the Bloomberg investment grade and high yield indices, spreads on the 5-year investment grade and high yield index credit default swaps, 10-year Treasury and SOFR rates, the 30-year MBS par coupon, and the MOVE and VIX option indices. Pre-War correlation reflects data from 9/26/25 to 12/26/25. War correlation reflects data from 2/27/26 to 3/25/26.
Source: Bloomberg, Santander US Capital Markets
One remaining diversifier: cash
The shift in correlation has reduced portfolio diversification and made hedging a different exercise than before war broke out. The value of diversifying assets has clearly gone up. Finding them, however, is only getting harder. Of course, one asset still can promise a reliable return with little correlation to the swings in other market instruments: cash. It just sits around these days spinning off something in the neighborhood of 3.65% interest or better and waiting to get redeployed. That may be the only refuge in a war-torn portfolio.
This material is intended only for institutional investors and does not carry all of the independence and disclosure standards of retail debt research reports. In the preparation of this material, the author may have consulted or otherwise discussed the matters referenced herein with one or more of SCM’s trading desks, any of which may have accumulated or otherwise taken a position, long or short, in any of the financial instruments discussed in or related to this material. Further, SCM may act as a market maker or principal dealer and may have proprietary interests that differ or conflict with the recipient hereof, in connection with any financial instrument discussed in or related to this material.
This message, including any attachments or links contained herein, is subject to important disclaimers, conditions, and disclosures regarding Electronic Communications, which you can find at https://portfolio-strategy.apsec.com/sancap-disclaimers-and-disclosures.
Important Disclaimers
Copyright © 2026 Santander US Capital Markets LLC and its affiliates (“SCM”). All rights reserved. SCM is a member of FINRA and SIPC. This material is intended for limited distribution to institutions only and is not publicly available. Any unauthorized use or disclosure is prohibited.
In making this material available, SCM (i) is not providing any advice to the recipient, including, without limitation, any advice as to investment, legal, accounting, tax and financial matters, (ii) is not acting as an advisor or fiduciary in respect of the recipient, (iii) is not making any predictions or projections and (iv) intends that any recipient to which SCM has provided this material is an “institutional investor” (as defined under applicable law and regulation, including FINRA Rule 4512 and that this material will not be disseminated, in whole or part, to any third party by the recipient.
The author of this material is an economist, desk strategist or trader. In the preparation of this material, the author may have consulted or otherwise discussed the matters referenced herein with one or more of SCM’s trading desks, any of which may have accumulated or otherwise taken a position, long or short, in any of the financial instruments discussed in or related to this material. Further, SCM or any of its affiliates may act as a market maker or principal dealer and may have proprietary interests that differ or conflict with the recipient hereof, in connection with any financial instrument discussed in or related to this material.
This material (i) has been prepared for information purposes only and does not constitute a solicitation or an offer to buy or sell any securities, related investments or other financial instruments, (ii) is neither research, a “research report” as commonly understood under the securities laws and regulations promulgated thereunder nor the product of a research department, (iii) or parts thereof may have been obtained from various sources, the reliability of which has not been verified and cannot be guaranteed by SCM, (iv) should not be reproduced or disclosed to any other person, without SCM’s prior consent and (v) is not intended for distribution in any jurisdiction in which its distribution would be prohibited.
In connection with this material, SCM (i) makes no representation or warranties as to the appropriateness or reliance for use in any transaction or as to the permissibility or legality of any financial instrument in any jurisdiction, (ii) believes the information in this material to be reliable, has not independently verified such information and makes no representation, express or implied, with regard to the accuracy or completeness of such information, (iii) accepts no responsibility or liability as to any reliance placed, or investment decision made, on the basis of such information by the recipient and (iv) does not undertake, and disclaims any duty to undertake, to update or to revise the information contained in this material.
Unless otherwise stated, the views, opinions, forecasts, valuations, or estimates contained in this material are those solely of the author, as of the date of publication of this material, and are subject to change without notice. The recipient of this material should make an independent evaluation of this information and make such other investigations as the recipient considers necessary (including obtaining independent financial advice), before transacting in any financial market or instrument discussed in or related to this material.
Important disclaimers for clients in the EU and UK
This publication has been prepared by Trading Desk Strategists within the Sales and Trading functions of Santander US Capital Markets LLC (“SanCap”), the US registered broker-dealer of Santander Corporate & Investment Banking. This communication is distributed in the EEA by Banco Santander S.A., a credit institution registered in Spain and authorised and regulated by the Bank of Spain and the CNMV. Any EEA recipient of this communication that would like to affect any transaction in any security or issuer discussed herein should do so with Banco Santander S.A. or any of its affiliates (together “Santander”). This communication has been distributed in the UK by Banco Santander, S.A.’s London branch, authorised by the Bank of Spain and subject to regulatory oversight on certain matters by the Financial Conduct Authority (FCA) and the Prudential Regulation Authority (PRA).
The publication is intended for exclusive use for Professional Clients and Eligible Counterparties as defined by MiFID II and is not intended for use by retail customers or for any persons or entities in any jurisdictions or country where such distribution or use would be contrary to local law or regulation.
This material is not a product of Santander´s Research Team and does not constitute independent investment research. This is a marketing communication and may contain ¨investment recommendations¨ as defined by the Market Abuse Regulation 596/2014 ("MAR"). This publication has not been prepared in accordance with legal requirements designed to promote the independence of research and is not subject to any prohibition on dealing ahead of the dissemination of investment research. The author, date and time of the production of this publication are as indicated herein.
This publication does not constitute investment advice and may not be relied upon to form an investment decision, nor should it be construed as any offer to sell or issue or invitation to purchase, acquire or subscribe for any instruments referred herein. The publication has been prepared in good faith and based on information Santander considers reliable as of the date of publication, but Santander does not guarantee or represent, express or implied, that such information is accurate or complete. All estimates, forecasts and opinions are current as at the date of this publication and are subject to change without notice. Unless otherwise indicated, Santander does not intend to update this publication. The views and commentary in this publication may not be objective or independent of the interests of the Trading and Sales functions of Santander, who may be active participants in the markets, investments or strategies referred to herein and/or may receive compensation from investment banking and non-investment banking services from entities mentioned herein. Santander may trade as principal, make a market or hold positions in instruments (or related derivatives) and/or hold financial interest in entities discussed herein. Santander may provide market commentary or trading strategies to other clients or engage in transactions which may differ from views expressed herein. Santander may have acted upon the contents of this publication prior to you having received it.
This publication is intended for the exclusive use of the recipient and must not be reproduced, redistributed or transmitted, in whole or in part, without Santander’s consent. The recipient agrees to keep confidential at all times information contained herein.


