The Long and Short
20-year trade crowded negating curve inversion
This material is a Marketing Communication and does not constitute Independent Investment Research.
The US Treasury curve is inverted at the long end with 20-year rates around 2 bp higher than 30-year. Conventional wisdom says this is an opportunity to overweight the 20-year part of the investment grade corporate curve, but the trade has gotten crowded. A closer look at segment fair value curves and real-world examples suggests a barbell approach to long duration in corporate credit should work better.
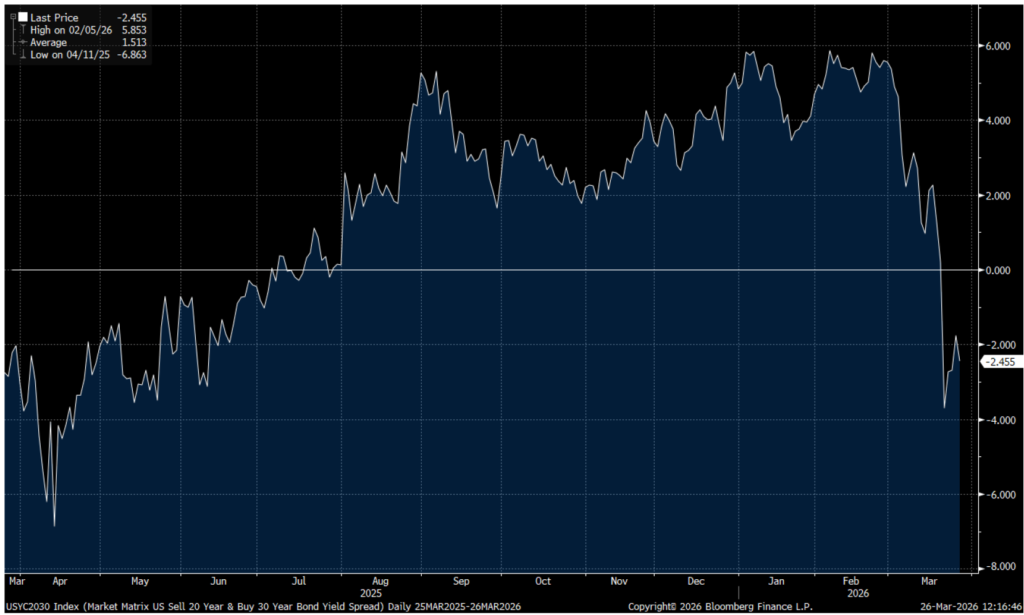
On March 19, the long end of the Treasury curve inverted for the first time since last July. Those market conditions had persisted since the later tail of the Covid crisis in 2021 but returned to normal last summer and remained that way until the recent spike in inflation concerns (Exhibit 1).
Exhibit 1. UST 20s/30s yield curve – five year history
Source: Bloomberg LP
As the global conflict in Iran has escalated, higher oil prices have stoked inflation concerns, further dampening the prospect for Fed rate cuts and leading to higher base rates over the past four weeks. Meanwhile, investment grade corporate bond spreads peaked right around the same time the curve inverted, with the index hitting a local peak of 93 bp before gradually receding back over the next week or so.
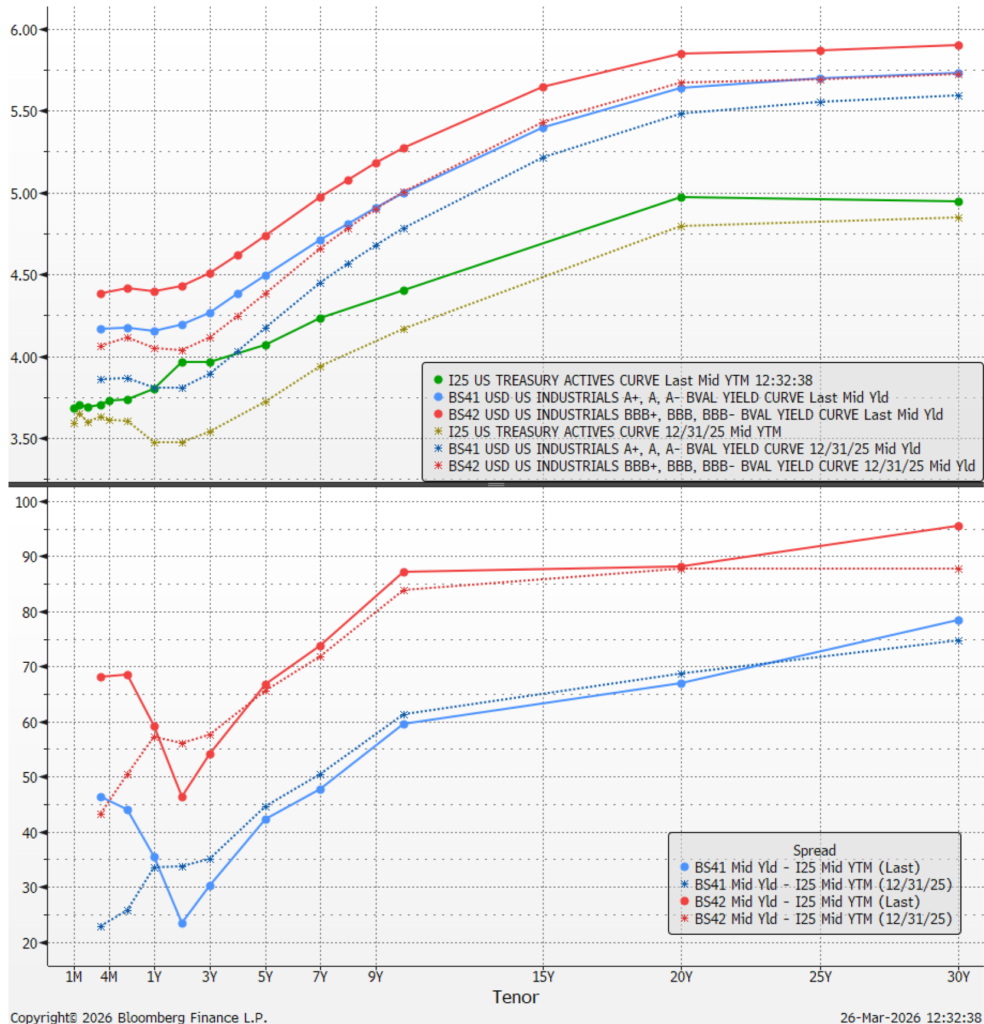
On Exhibit 2, the top graphic demonstrates the change in the US Treasury yield curve versus year-end 2025 (green) and the current shape of the fair value yield curve for single-A rated industrials (blue) as well as BBB-rated industrials (red). Beneath that, current investment grade spreads over Treasuries demonstrate the current shapes of the single-A and BBB-rated industrial spread curves versus year-end as well. Notable steepness in the long-end of the IG spread curve versus year-end highlights that both cohorts indicate that 20-year maturities have been overbought in recent weeks favoring a barbell approach to long duration in both A- and BBB-rated industrial securities.
Exhibit 2. Yield and Spread Curves – Industrials (A, BBB) versus UST
Source: Bloomberg LP – Bloomberg fair value curves
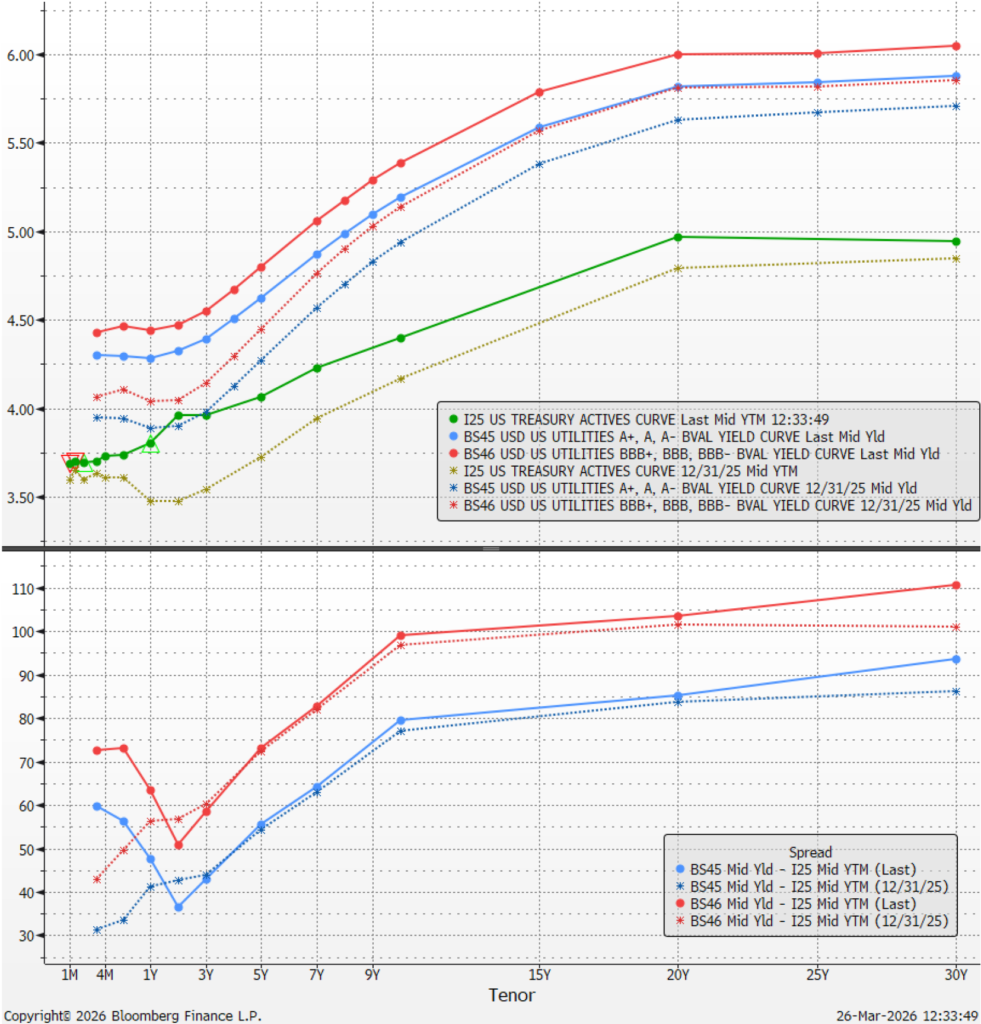
Shifting focus to the utilities sector, a segment of the market that often offers opportunities to target undervalued, seasoned 20-year paper with exceptional value relative to the long-end. On Exhibit 3, the top graphic demonstrates the change in the US Treasury yield curve versus year-end 2025 (green) and the current shape of the fair value yield curve for single-A rated utilities (blue) as well as BBB-rated utilities (red). Beneath that, current investment grade spreads over treasuries demonstrate the current shapes of the single-A and BBB-rated utilities spread curves versus year-end as well. Once again, even more steepness in the long-end of the investment grade spread curve versus year-end highlights that in both cohorts, 20-year maturities have been substantially overbought in recent weeks favoring a barbell approach to long duration in both A- and BBB-rated utilities securities.
Exhibit 3. Yield and Spread Curves – Industrials (A, BBB) versus UST
Source: Bloomberg LP – Bloomberg fair value curves
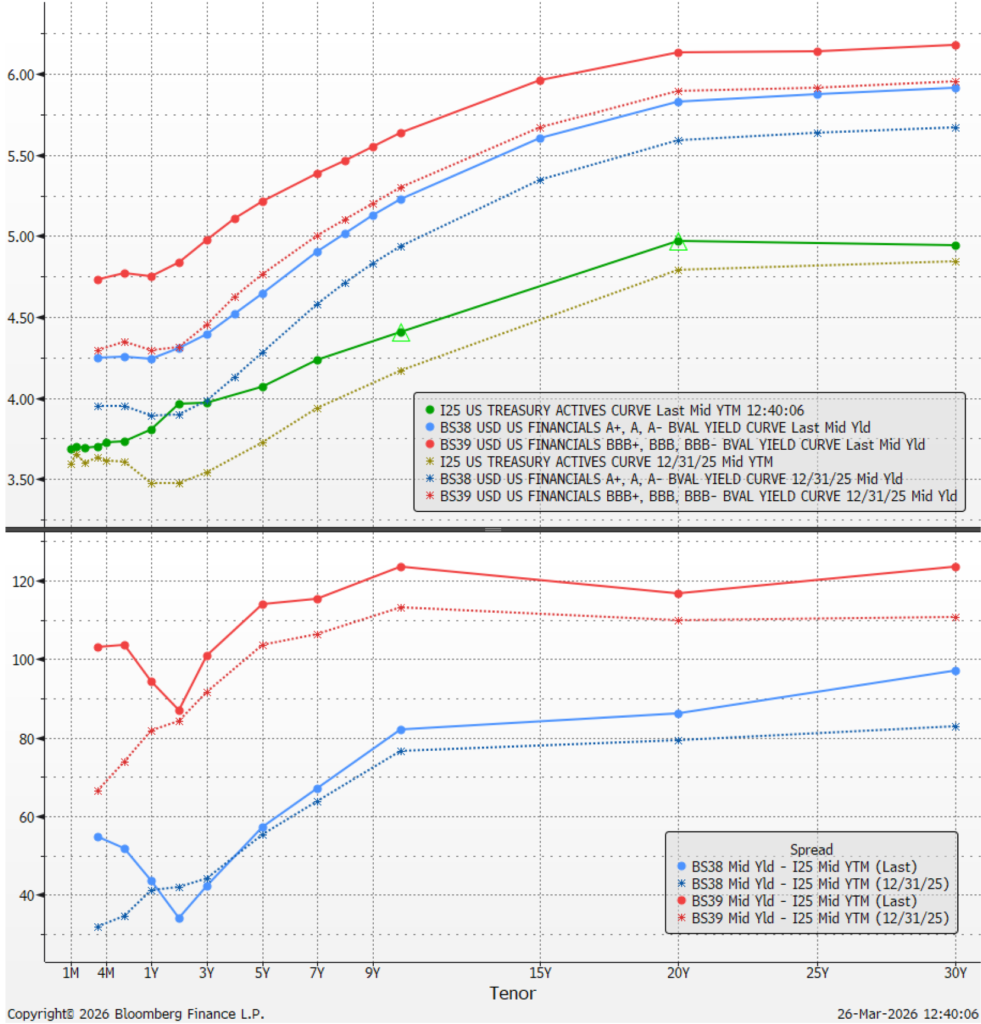
Financials have been particularly hard hit with the recent sell-off in spreads as private credit concerns have taken an even greater priority among credit investors than the recent geopolitical events. Specific segments of the sector have been rapidly repriced since the tights of January, including: life insurance, brokers/private equity and business development companies (BDCs). The latter two have minimal if any concentration in the long end of the curve, but insurance offers plenty of longer-dated securities. On Exhibit 4, the top graphic demonstrates the change in the US Treasury yield curve versus year-end 2025 (green) and the current shape of the fair value yield curve for single-A rated financials (blue) as well as BBB-rated financials (red). Beneath that, current investment grade spreads over Treasuries demonstrate the current shapes of the single-A and BBB-rated financials spread curve versus year-end as well. Lastly, the financials sector demonstrates similar type of pressure on 20-year maturity spreads, perhaps even more so than the other sectors as the 10s/20s spread curve is distinctly inverted for BBB-rated financials. This once again favors a barbell approach to long duration in both A- and BBB-rated financials securities.
Exhibit 4. Yield and Spread Curves – Financials (A, BBB) versus UST
Source: Bloomberg LP – Bloomberg fair value curves
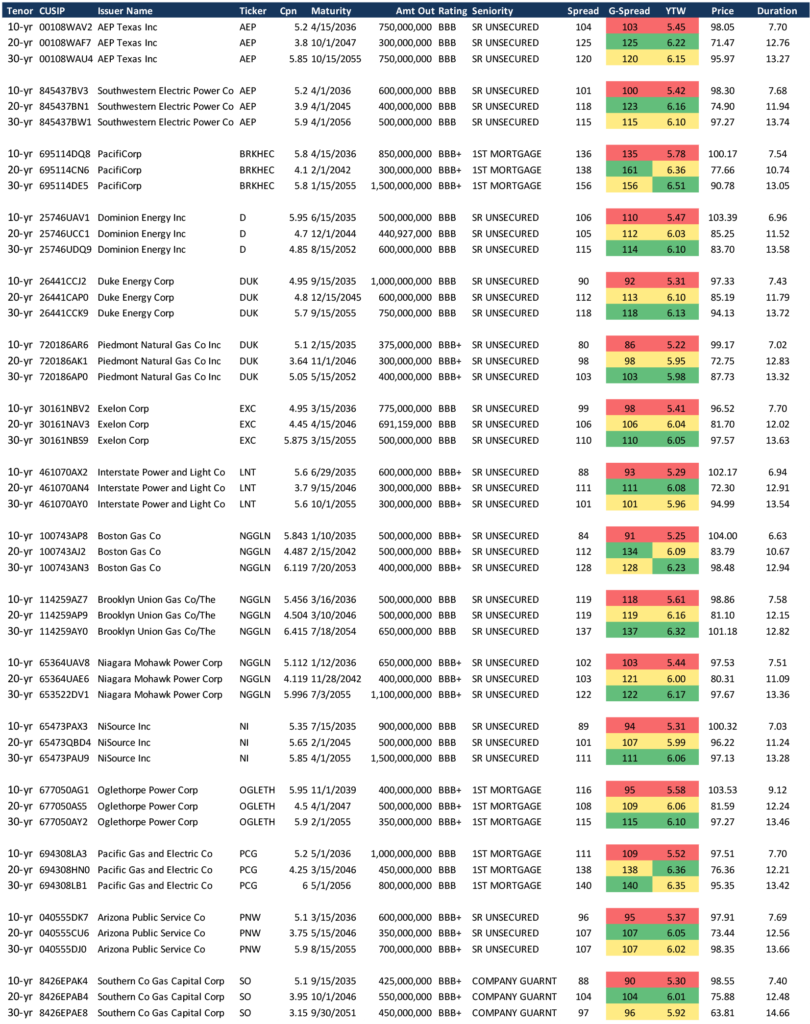
While the Bloomberg fair value curves are mostly conclusive that the 20-year bucket appears overbought, taking some real-world market examples demonstrates a more mixed result regarding the attractiveness of 20-year maturities amidst UST curve inversion. Taking a sample of bond pairings from the BBB-rated utilities segment (Exhibit 5 below), there still appear to be select opportunities to target seasoned 20-year paper at a yield pick to commensurate long-dated debt in multiple issuers from the sample set below. The relationships in the long-end of the curve are flat overall, but a selective approach enables investors to maximize their spread/yield opportunities in this current environment. Some of the more attractive options for 20-year issues from the sample below include: AEP, PacifiCorp (BRKHEC), LNT, Boston Gas (NGGLN), PNW and SO.
Exhibit 5. BBB-rated Utilities – 10s/20s/30s bond pricing
Source: Bloomberg/TRACE YAS spread and yield indications only
This material is intended only for institutional investors and does not carry all of the independence and disclosure standards of retail debt research reports. In the preparation of this material, the author may have consulted or otherwise discussed the matters referenced herein with one or more of SCM’s trading desks, any of which may have accumulated or otherwise taken a position, long or short, in any of the financial instruments discussed in or related to this material. Further, SCM may act as a market maker or principal dealer and may have proprietary interests that differ or conflict with the recipient hereof, in connection with any financial instrument discussed in or related to this material.
This message, including any attachments or links contained herein, is subject to important disclaimers, conditions, and disclosures regarding Electronic Communications, which you can find at https://portfolio-strategy.apsec.com/sancap-disclaimers-and-disclosures.
Important Disclaimers
Copyright © 2026 Santander US Capital Markets LLC and its affiliates (“SCM”). All rights reserved. SCM is a member of FINRA and SIPC. This material is intended for limited distribution to institutions only and is not publicly available. Any unauthorized use or disclosure is prohibited.
In making this material available, SCM (i) is not providing any advice to the recipient, including, without limitation, any advice as to investment, legal, accounting, tax and financial matters, (ii) is not acting as an advisor or fiduciary in respect of the recipient, (iii) is not making any predictions or projections and (iv) intends that any recipient to which SCM has provided this material is an “institutional investor” (as defined under applicable law and regulation, including FINRA Rule 4512 and that this material will not be disseminated, in whole or part, to any third party by the recipient.
The author of this material is an economist, desk strategist or trader. In the preparation of this material, the author may have consulted or otherwise discussed the matters referenced herein with one or more of SCM’s trading desks, any of which may have accumulated or otherwise taken a position, long or short, in any of the financial instruments discussed in or related to this material. Further, SCM or any of its affiliates may act as a market maker or principal dealer and may have proprietary interests that differ or conflict with the recipient hereof, in connection with any financial instrument discussed in or related to this material.
This material (i) has been prepared for information purposes only and does not constitute a solicitation or an offer to buy or sell any securities, related investments or other financial instruments, (ii) is neither research, a “research report” as commonly understood under the securities laws and regulations promulgated thereunder nor the product of a research department, (iii) or parts thereof may have been obtained from various sources, the reliability of which has not been verified and cannot be guaranteed by SCM, (iv) should not be reproduced or disclosed to any other person, without SCM’s prior consent and (v) is not intended for distribution in any jurisdiction in which its distribution would be prohibited.
In connection with this material, SCM (i) makes no representation or warranties as to the appropriateness or reliance for use in any transaction or as to the permissibility or legality of any financial instrument in any jurisdiction, (ii) believes the information in this material to be reliable, has not independently verified such information and makes no representation, express or implied, with regard to the accuracy or completeness of such information, (iii) accepts no responsibility or liability as to any reliance placed, or investment decision made, on the basis of such information by the recipient and (iv) does not undertake, and disclaims any duty to undertake, to update or to revise the information contained in this material.
Unless otherwise stated, the views, opinions, forecasts, valuations, or estimates contained in this material are those solely of the author, as of the date of publication of this material, and are subject to change without notice. The recipient of this material should make an independent evaluation of this information and make such other investigations as the recipient considers necessary (including obtaining independent financial advice), before transacting in any financial market or instrument discussed in or related to this material.
Important disclaimers for clients in the EU and UK
This publication has been prepared by Trading Desk Strategists within the Sales and Trading functions of Santander US Capital Markets LLC (“SanCap”), the US registered broker-dealer of Santander Corporate & Investment Banking. This communication is distributed in the EEA by Banco Santander S.A., a credit institution registered in Spain and authorised and regulated by the Bank of Spain and the CNMV. Any EEA recipient of this communication that would like to affect any transaction in any security or issuer discussed herein should do so with Banco Santander S.A. or any of its affiliates (together “Santander”). This communication has been distributed in the UK by Banco Santander, S.A.’s London branch, authorised by the Bank of Spain and subject to regulatory oversight on certain matters by the Financial Conduct Authority (FCA) and the Prudential Regulation Authority (PRA).
The publication is intended for exclusive use for Professional Clients and Eligible Counterparties as defined by MiFID II and is not intended for use by retail customers or for any persons or entities in any jurisdictions or country where such distribution or use would be contrary to local law or regulation.
This material is not a product of Santander´s Research Team and does not constitute independent investment research. This is a marketing communication and may contain ¨investment recommendations¨ as defined by the Market Abuse Regulation 596/2014 ("MAR"). This publication has not been prepared in accordance with legal requirements designed to promote the independence of research and is not subject to any prohibition on dealing ahead of the dissemination of investment research. The author, date and time of the production of this publication are as indicated herein.
This publication does not constitute investment advice and may not be relied upon to form an investment decision, nor should it be construed as any offer to sell or issue or invitation to purchase, acquire or subscribe for any instruments referred herein. The publication has been prepared in good faith and based on information Santander considers reliable as of the date of publication, but Santander does not guarantee or represent, express or implied, that such information is accurate or complete. All estimates, forecasts and opinions are current as at the date of this publication and are subject to change without notice. Unless otherwise indicated, Santander does not intend to update this publication. The views and commentary in this publication may not be objective or independent of the interests of the Trading and Sales functions of Santander, who may be active participants in the markets, investments or strategies referred to herein and/or may receive compensation from investment banking and non-investment banking services from entities mentioned herein. Santander may trade as principal, make a market or hold positions in instruments (or related derivatives) and/or hold financial interest in entities discussed herein. Santander may provide market commentary or trading strategies to other clients or engage in transactions which may differ from views expressed herein. Santander may have acted upon the contents of this publication prior to you having received it.
This publication is intended for the exclusive use of the recipient and must not be reproduced, redistributed or transmitted, in whole or in part, without Santander’s consent. The recipient agrees to keep confidential at all times information contained herein.


