


By the Numbers
Slower refinancing in November points to faster burnout
Brian Landy, CFA | December 5, 2025
This material is a Marketing Communication and does not constitute Independent Investment Research.
Low mortgage rates in September and October set the stage for the biggest test of MBS convexity of the last few years. Speeds increased more than expected in October but in November fell roughly 20% to an average of just under 9 CPR despite lower lagged mortgage rates. That is good news—suggesting that while speeds may jump faster and higher after a drop in rates, more rapid burnout may balance things out. More efficient mortgage originators may be better at pulling prepayments forward than at inducing prepayments in borrowers that otherwise would not have refinanced.
The speed results also highlighted certain spec pool categories that provided better and worse prepayment protection. Strong prepayment protection came from low loan balance and New York. Weak protection came from investor and Texas pools.
There was some concern that specified pool speeds could come in stronger than expected as generic speeds eased, but that was not evident in the results.
Drop in speeds depended on coupon
In total, 30-year MBS at Fannie Mae slowed 20% to 8.4 CPR and Freddie Mac slowed 21% to 9.1 CPR. Most coupons 5% and lower slowed in-line with the drop in day count, while higher coupons slowed as much as 25% from the drop in refinancing. For example, Fannie 6.5%s 2024 slowed 25.6% to 36.5 CPR from 46.0 CPR. Ginnie Mae results were similar, slowing 17% overall. Compared to conventional, the declines were a bit larger in discount Ginnies and a bit smaller in premium Ginnies.
Exhibit 1. November 2025 Agency Prepayment Speeds, % Change
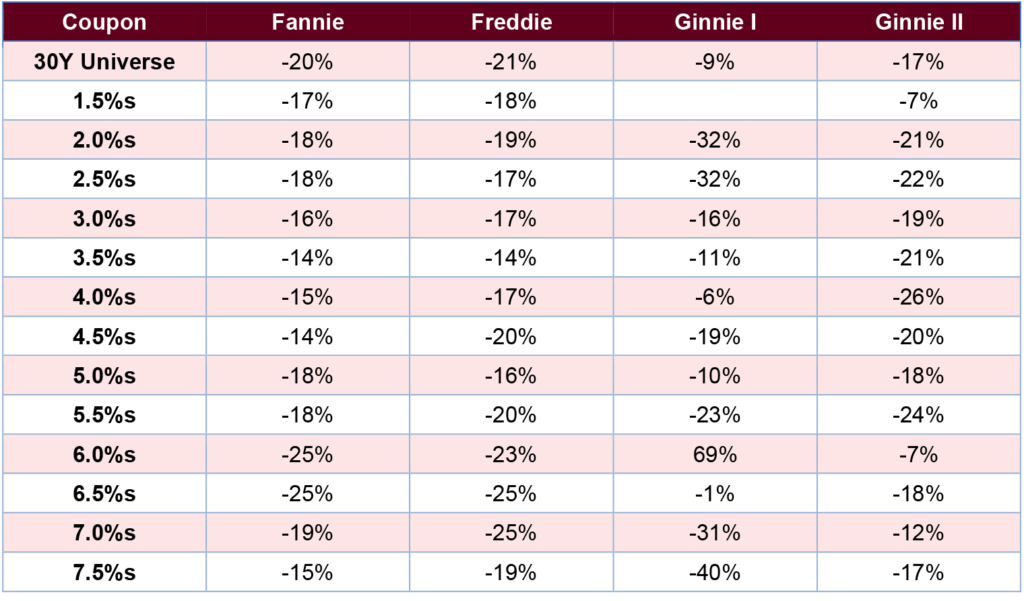
Source: Fannie Mae, Freddie Mac, Ginnie Mae, Santander US Capital Markets.
Yield Book experimental model did well
Yield Book’s latest experimental model captured November speeds well, with errors less than 10% in nearly every coupon (Exhibit 2). It was even a little fast on 6%s. It did, however, continue to struggle with coupons near par, like 5%s this month. Actual speeds are likely to fall more than the model predicts next month, since lagged rates remain relatively low but indicators like the MBA’s refinance index keep fading. Yield Book’s production model and Bloomberg’s model were both slow across most premium coupons.
Exhibit 2. FNCL model predicted vs. actual
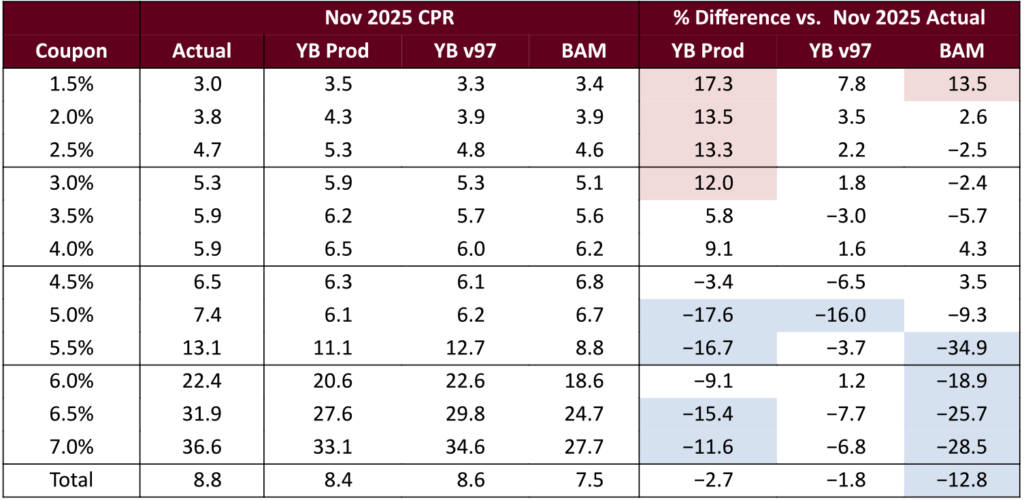
Shaded cells are more than 10% different from speeds inferred from the daily prepayment report. Blue indicates the model is slower, red indicates the model is faster. Yield Book v97 is the latest experimental model released in October 2025.
Source: Fannie Mae, Freddie Mac, Yield Book, Bloomberg, Santander US Capital Markets.
All three models were too slow on Ginnie Mae collateral in November (Exhibit 3). Yield Book’s experimental model was an improvement over its production model for discount collateral but was roughly 20% slow on most coupons 5% and higher.
Exhibit 3. G2SF model predicted vs. actual, multiple issuer pools
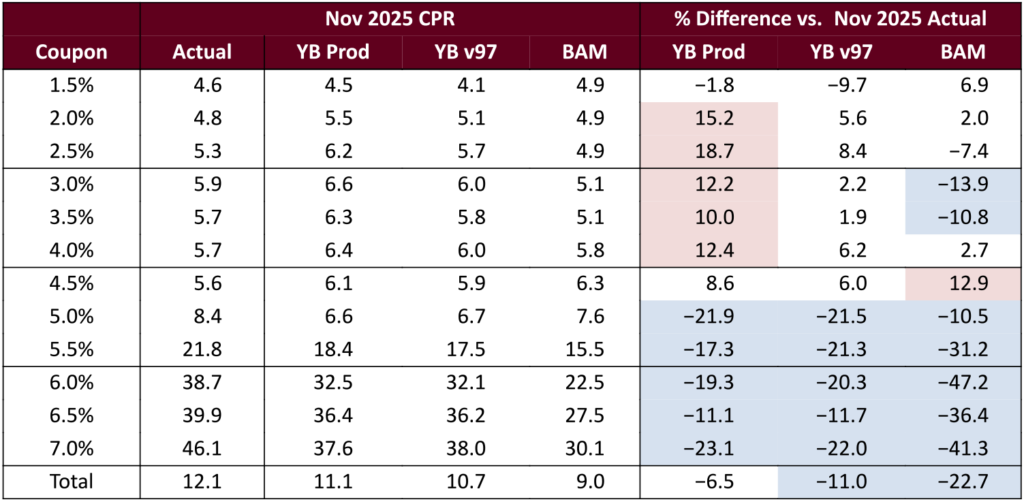
Shaded cells are more than 10% different from speeds inferred from the daily prepayment report. Blue indicates the model is slower, red indicates the model is faster. Yield Book v97 is the latest experimental model released in October 2025.
Source: Ginnie Mae, Yield Book, Bloomberg, Santander US Capital Markets.
Prepayment outlook: a rebound in December
Prepayment speeds are likely to rebound higher in December, but primarily from a big increase in day count. Four additional business days could lift speeds around 22%, all else equal. However, lagged mortgage rates are roughly unchanged, and the refinance index keeps trending lower (Exhibit 4). This should lessen the increase in higher coupons. Overall speeds should increase about 10% to 15%, discounts should increase about 20% and premium coupons only about 5%.
Exhibit 4. MBA Refinance index
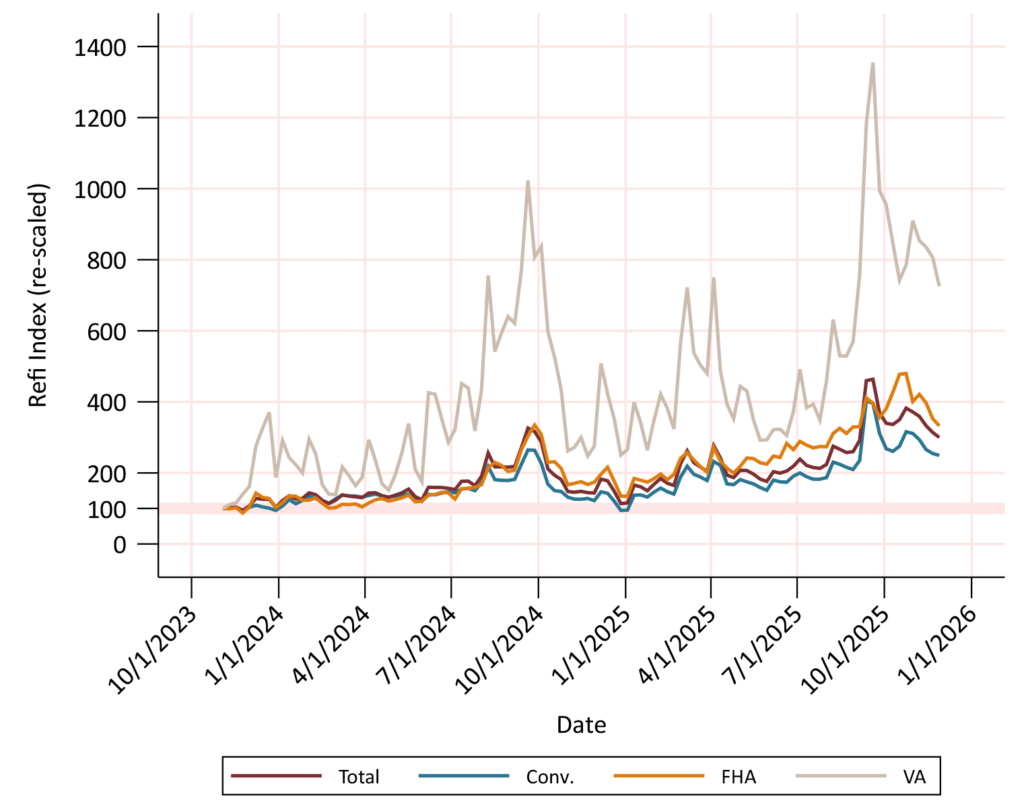
Source: Mortgage Bankers Association, Bloomberg, Santander US Capital Markets.
Specified pool recap for in-the-money coupons
Several factors are lowering the convexity of generic pools—higher home values lead to origination of larger loans, more efficient specified pooling leaves more negatively convex loans in generic pools, and concerns about technological innovations, including artificial intelligence, that may induce more borrowers to refinance. October’s speeds, which were much faster than model projections, sounded the alarm that technology may have permanently lowered convexity. But the November results suggest that these faster speeds are quickly eroding.
Comparing speeds to a year earlier
A useful way to see this is to compare speeds for the 2023 and 2024 vintages in October and November to speeds of the 2023 vintage a year before in October 2024, when primary mortgage rates were very similar. Even after adjusting for the low day count in November this shows that generic speeds have already started to moderate. The 6%s and 6.5%s 2023 prepaid similarly in October 2024 and November 2025. The 6%s and 6.5%s 2024 in November prepaid mid-way between their October print and the same-coupon 2023 print last year. That is rapid burnout after only one month of prepayments. A likely explanation is that short timelines to close loans are pulling prepayments forward and not necessarily creating many new prepayments.
Looking back at specified pool performance by coupon
The comparison also shows that some specified pool types were better than others at providing stable prepayments in these three months. Low loan balance and New York pools were the strongest performers. On the other hand, investor and Texas pools prepaid very fast in October. Texas pools improved in November, but investor pools generally stayed fast.
Speeds in 5.5%s 2024 remained tame in most specified pool categories in November (Exhibit 5). Most pool types had comparable prepayments across all three months. Texas pools slowed considerably in November, and Florida pools dropped back to speeds comparable to last year. Investor pools, however, remained fast.
Exhibit 5. FNCL 5.5% 2024 specified pool results
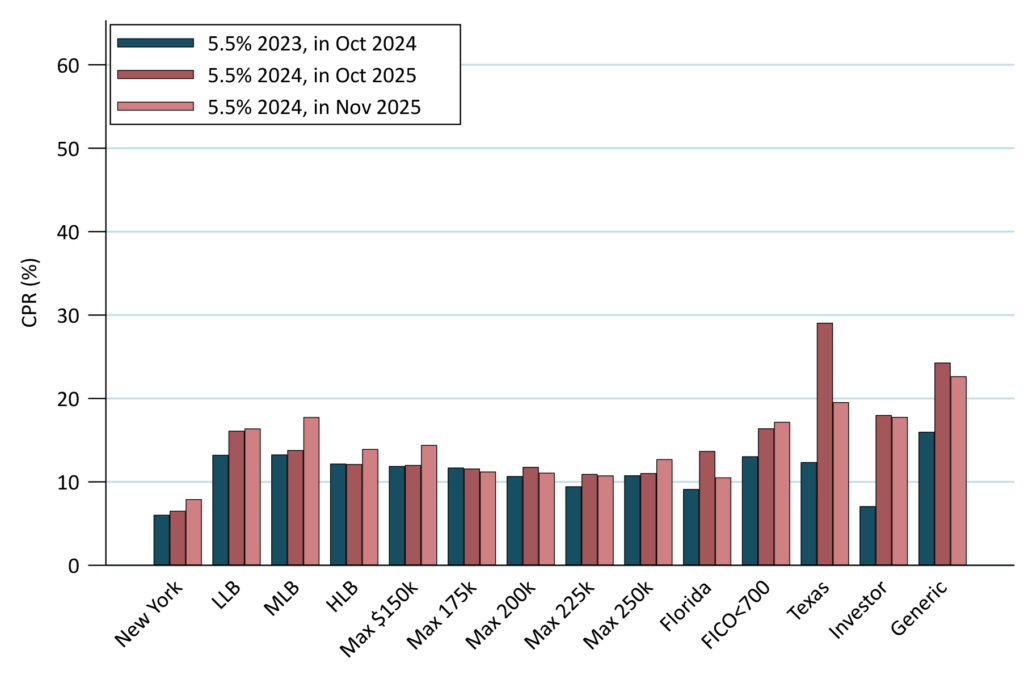
November speeds scaled faster by 22% to account for day count difference.
Source: Fannie Mae, Freddie Mac, Santander US Capital Markets.
The 5.5%s 2023 prepaid consistently in most categories across all three months (Exhibit 6). In general, speeds have been tamer on this vintage compared to the 2024s.
Exhibit 6. FNCL 5.5% 2023 specified pool results
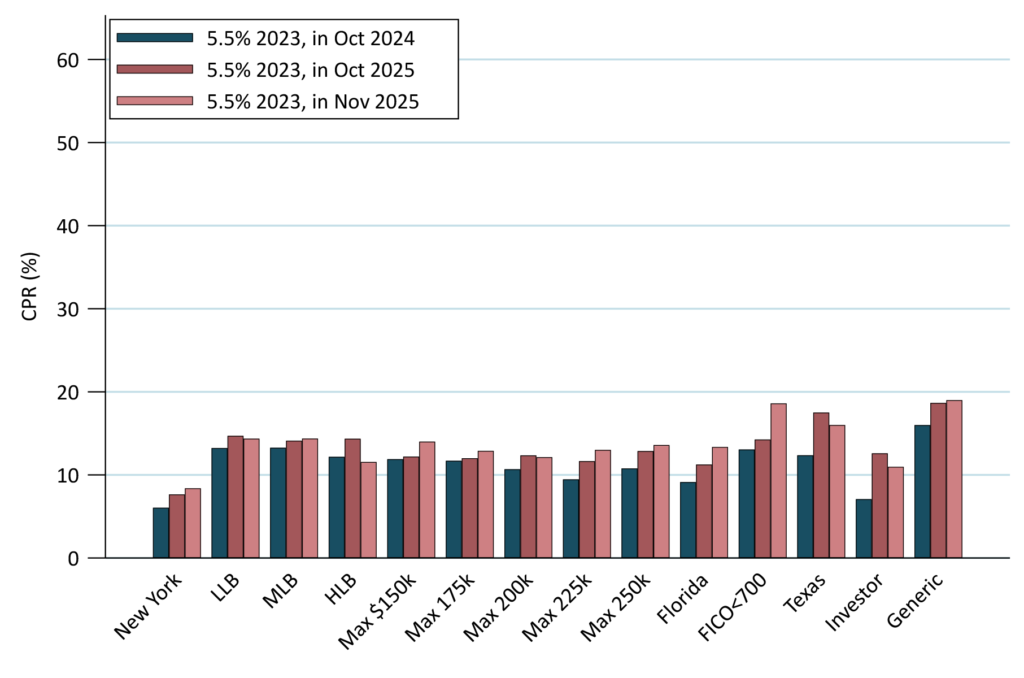
November speeds scaled faster by 22% to account for day count difference.
Source: Fannie Mae, Freddie Mac, Santander US Capital Markets.
Speeds on low loan balance 6.0%s were stable in November (Exhibit 7). New York pools edged faster but stayed slow in absolute terms. Texas, Florida and generic pool speeds all improved. Investor speeds stayed fast.
Exhibit 7. FNCL 6.0% 2024 specified pool results
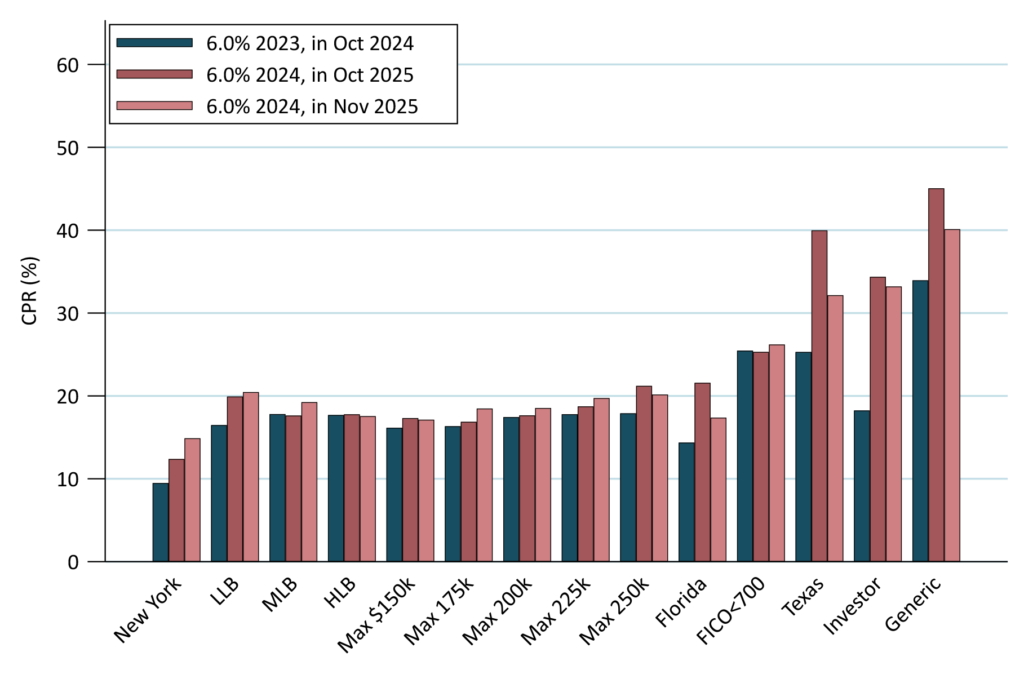
November speeds scaled faster by 22% to account for day count difference.
Source: Fannie Mae, Freddie Mac, Santander US Capital Markets.
The 6%s 2033 largely prepaid in-line with 2024 (Exhibit 8). Unlike other cohorts, these investor pools did not prepay much faster in 2025 than in 2023. The generics were slower in November than they were last year. Only the Florida pools were noticeably faster in October and November.
Exhibit 8. FNCL 6.0% 2023 specified pool results
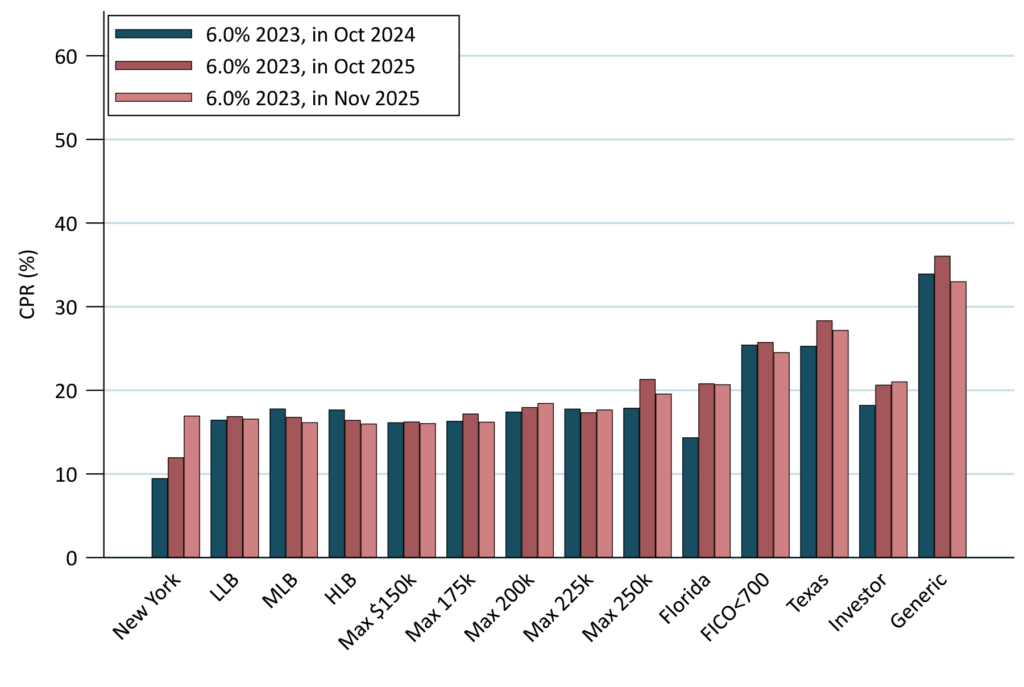
November speeds scaled faster by 22% to account for day count difference.
Source: Fannie Mae, Freddie Mac, Santander US Capital Markets.
The 6.5%s 2024 results echo many of the observations from the 6%s, although since speeds are closer to peak the differences are less extreme (Exhibit 9). Low loan balance speeds were consistent across all three months. Florida, Texas and generic pools all showed improvement from October to November. New York speeds picked up in November but were comparable to LLB.
Exhibit 9. FNCL 6.5% 2024 specified pool results
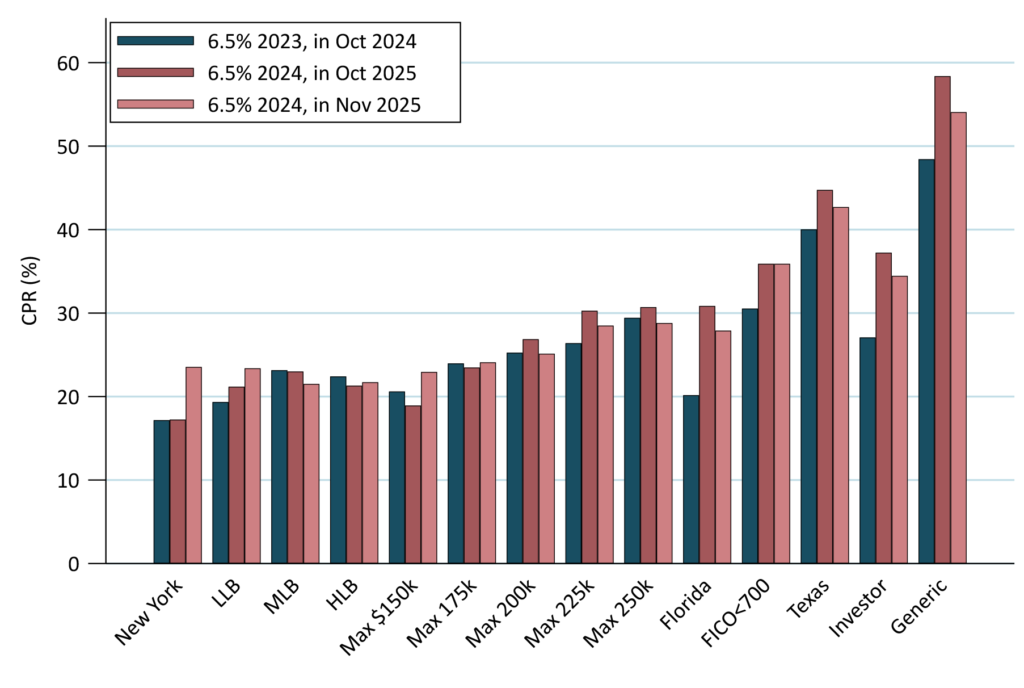
November speeds scaled faster by 22% to account for day count difference.
Source: Fannie Mae, Freddie Mac, Santander US Capital Markets.
The 6.5%s 2023 also corroborate many of the themes from the other cohorts (Exhibit 10). Generic speeds fell back to last year’s level and loan balance speeds were consistent. New York pools moved faster but were still comparable to low loan balance buckets. Texas and investor showed modest improvement, but Florida pools remained faster than last year.
Exhibit 10. FNCL 6.5% 2023 specified pool results
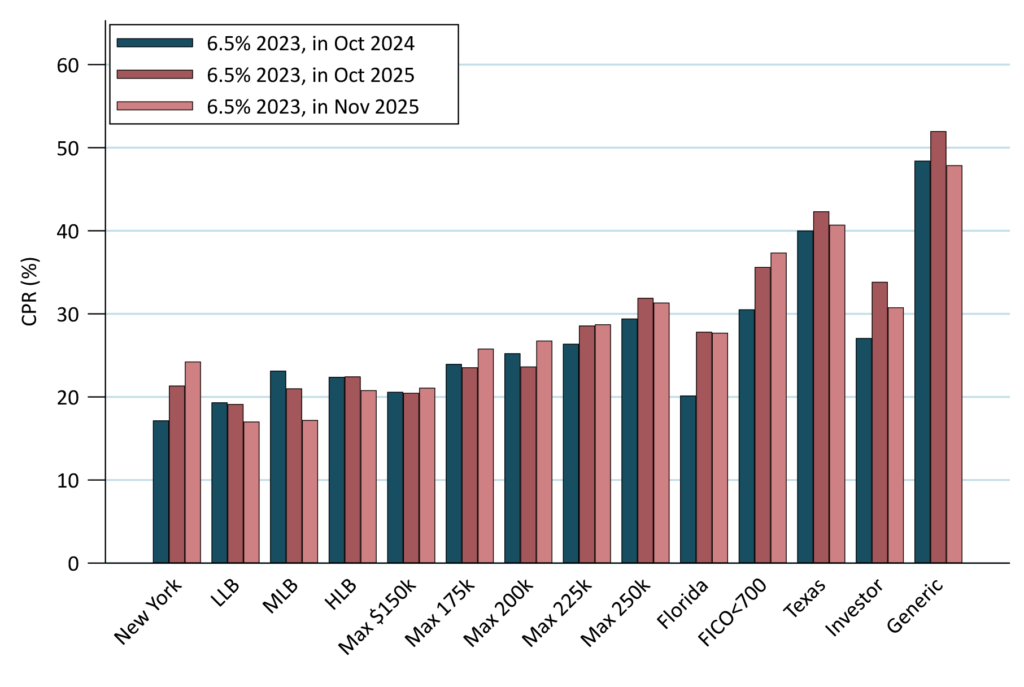
November speeds scaled faster by 22% to account for day count difference.
Source: Fannie Mae, Freddie Mac, Santander US Capital Markets.