


The Big Idea
Out-of-consensus calls on US markets in 2026
Steven Abrahams | November 21, 2025
This material is a Marketing Communication and does not constitute Independent Investment Research.
Excess return gets made or lost in places where markets defy expectations. Those places next year include longer maturities in US rates, where yields look likely to top implied forwards, and funding markets, where rates look likely to stay stubbornly choppy. Policy uncertainty should decline by the end of the year, and volatility with it. The tide of private debt should slow, and the split between household haves and have-nots should widen with clear impact on consumer credit. Each of these areas offer a little surprise for markets in 2026.
#1: US long-term rates remain stubbornly high
The yield on the US 10-year has ranged between 4.00% and 4.20% since September with the 1-year forward 10-year rate now around 4.25%. But there are good reasons to expect the 10-year to trade above that forward for most of the coming year due mainly to monetary policy with limited effect from supply and demand.
Monetary policy makes the strongest case. Our colleague Stephen Stanley argues that persistent inflation and only modest weakening in labor will leave the Fed on hold for most of next year, much to the market’s surprise. If that play’s out, a simple regression between short- and long-term rates suggests the 10-year could spike back toward its 2025 high of 4.75%. Even if the Fed only cuts to it’s current median dot, also surprising markets, the 10-year should settle in a range between 4.25% and 4.40%.
Politics has become an adjunct to monetary policy this year with potential to play a role again next year. But even if the administration can arrange a more accommodating Fed—not the base case—it would likely come at a cost in longer rates. Rising expectations for inflation and real rates would still likely keep longer rates stubbornly high.
Supply looks likely to play a neutral role with coupon issuance similar to 2025 across maturities. The market already anticipates heavy US deficits, with the Congressional Budget Office projecting spending will exceed revenue by $1.9 trillion. The Treasury seems reluctant to let T-bills absorb more than the current 22% of outstanding debt, and with the end of QT and some possible Fed bond purchases to top up bank reserves, the coupon mix looks status quo.
As for demand, both foreign and domestic demand looks likely to stay on trend. Outside a brief “Sell America” moment in April, foreign investors have added to their holdings of US Treasury debt in 2025. And as long as US yields continue offering an attractive nominal and real pick-up over other strong sovereign paper, foreign investors should keep financing a good chunk of the US deficit. As for domestic demand, some regulatory relief for banks along with attractive yield should keep US investors doing their fair share without asking for a significantly higher term premium.
Antonio Villarroya
AntVillarroya@gruposantander.com
+034 615909786
#2: Repo delivers fresh surprises
Look for regular surprises in repo markets next year, adding some volatility to Treasury and MBS markets unless the Fed takes out its toolkit and fixes the Standing Repo Facility. Liquidity in US repo has gone from abundant to ample through QT, but the tools in place to keep rates from spiking above the fed funds target range do not seem to be working as well as expected. The Fed’s Standing Repo Facility in theory should put a ceiling on overnight rates, a complement to the floors created by the Fed’s Reverse Repo rate and by interest on reserve balances. The SRF currently lends at 4.00%, the top of the Fed target range, to any primary dealer or other counterparty that posts Treasury or agency debt or agency MBS. If repo rates move above 4.00%, that should trigger a lot of borrowing to arbitrage the higher repo rate away. But lately that hasn’t worked. Repo, at least measured by SOFR, started popping above the Fed’s target range in mid-October (Exhibit 2). And repo desks anecdotally report plenty of funding above the current 4.00% target rate. Constitutional Avenue, we have a problem.
Exhibit 1: SOFR lately has moved above the top of the Fed target range
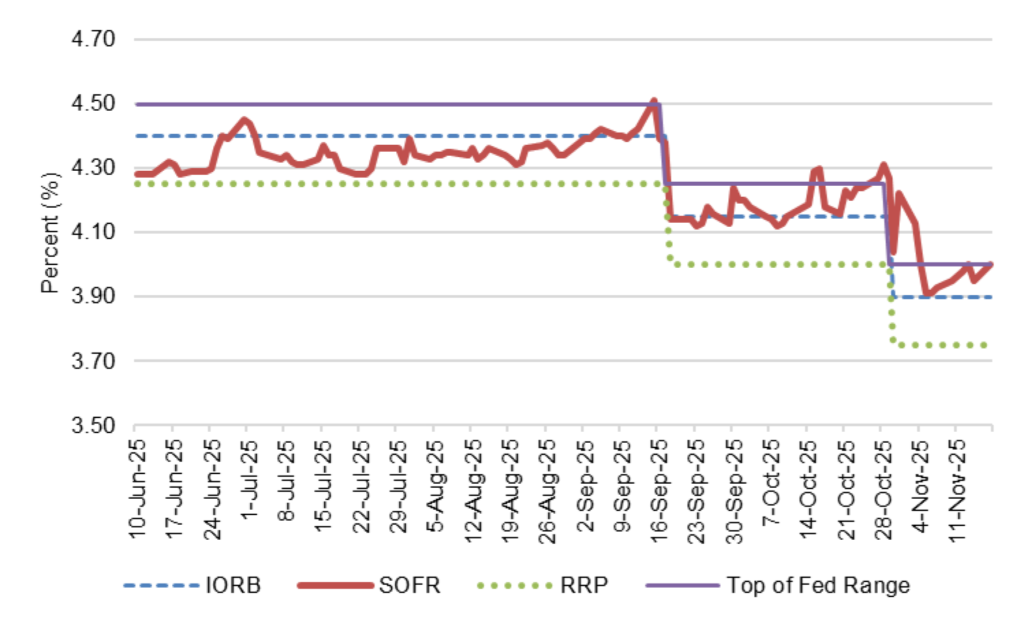
Source: Bloomberg, Santander US Capital Markets
Although conversations with the Fed are confidential, Bloomberg has reported a few obstacles to SRF uptake. Some counterparties worry about stigma from borrowing from the US government and having that eventually disclosed, some repo desks have to get permission from senior management and cannot move quickly enough to arbitrage higher rates away, and some worry about the impact on balance sheet. The Fed may be able to tweak the SRF by introducing central clearing or expanding the list of SRF counterparties, but in the meantime the risk is for repo surprises at each month end, each quarter end, when big Treasury auctions settle, possibly when corporate taxes are due and, well, you get the idea. In markets with lots of financed positions such as Treasury debt and agency MBS, it could take a toll.
#3: Policy uncertainty declines
The US House and Senate go up for grabs next year with prediction markets giving Democrats roughly a 70% chance to take the House and Republicans roughly a 70% chance to hold the Senate. A split Congress might turn the volume up on partisan theatrics, if that is even possible, but it also looks more likely to blunt dramatic changes in policies with direct impact on markets, such as tariffs and Fed independence. For markets, inertia could be surprisingly good. My colleague Stephen Stanley thinks the administration might even declare victory on tariffs and reduce policy risk before the midterms. In any event, look for volatility to drop further in the back half of 2026 and for carry to become more important for portfolio returns.
#4: The tide of private debt slows
Look for the tide of private lending to slow next year, not necessarily because of wobbling credit but thanks to fresh scrutiny from US bank regulators. A tap on the brakes of bank lending to private debt portfolios would trim the safety net for leveraged companies burning cash and boost delinquencies and distressed exchanges. Next year looks like a good one for adding liquidity in credit.
The regulator scrutiny comes from the increasing role banks play as lenders to pools of private debt. Lending from US commercial banks to non-bank financial institutions jumped by a striking 46% in the last year with total assets up only 4%, an open invitation to put it in the regulatory klieg lights. Regulators have already moved in that direction with the Fed and the International Monetary Fund giving it fresh attention.
The link between banks and the front lines of private debt admittedly is a bit fuzzy. NBFI lending includes borrowers ranging from insurers, pensions, mortgage originators, REITs, brokers and securitization vehicles as well as the private debt funds and business development companies with lead roles in private direct lending. Banks do not report lending by each type of NBFI, but the Fed sees it through confidential stress test disclosures on FR Y-14Q. The Fed has focused on the subset of bank lending to private debt funds and BDCs, showing it outstripping lending to other NBFIs. But the initial analysis shows the lending as generally safer than loans to other NBFIs with limited risk to bank stability.
Nevertheless, recent news from First Brands and Tricolor along with loan losses at Western Alliance and Zions has almost certainly prompted some bank re-underwriting of NBFI loans and new attention from bank regulators. New scrutiny should add friction to lending across NBFIs, slowing the tide. The concern is that the steady rise of private credit has relied on steady economic growth and a steady tide of new, creative lenders to help clean up any portfolio problems. If the tide slows, more rocks might start showing up.
#5: Banks take a bigger bite of securities markets
Any slowing of bank lending to NBFI is likely to translate into growth in investment portfolios, giving a lift to Treasury debt and agency MBS. Banks have relied heavily on NBFI lending to lift asset growth with that sleeve up 45.6% in the last year, for example, while real estate lending is up only 1.3%, consumer lending down 4.3% and C&I lending down 4.6% (Exhibit 2). Any slowing in NBFI is likely to leave banks with rising balances in cash and insufficient demand from other parts of the lending book. That cash should flow into the investment portfolio, where banks look likely to have a healthy appetite for Treasury debt and for a mix of agency MBS pass-throughs and CMOs. With net MBS supply likely to be low for a second year, marginal bank demand should keep spreads flat-to-tighter.
Exhibit 2: Any slowing in NBFI lending should push bank cash toward securities
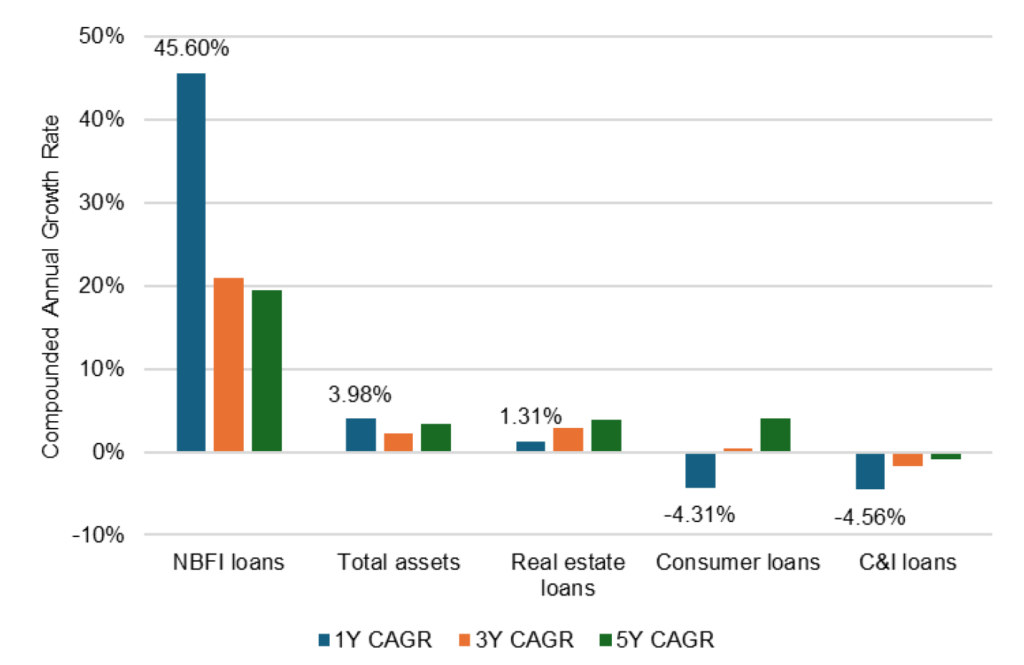
Source: Federal Reserve, H.8, Santander US Capital Markets
#6: The split-screen view of household credit splits further
High-income households have become stronger in 2025, and low-income household weaker, a split that shows up in mortgage delinquencies along with delinquencies in credit card, auto and student loans. Look for that split to get even wider next year as shifts in US taxes and spending kick in. At current pricing, that argues for taking the credit risk of prime households and avoiding the credit risk of subprime.
July’s One Big Beautiful Bill Act cuts taxes on one hand but reduces outlays for health care, student loans and food programs on the other. The Congressional Budget Office estimates the average household will be better off, but the impact falls unevenly across the income distribution. The highest 70% of households end up with net gains in income largely from lower taxes, according to the CBO, while the lowest 30% end up with net losses from reductions in federal and state programs (Exhibit 3). All else equal, that marginally adds to pressure on the bottom third and relieves pressure on the rest. That should widen the difference in delinquency rates across subprime and prime consumer credit. Unless spreads or subordination levels or both start to anticipate the credit split, avoid the subprime and take on the prime.
Exhibit 3: Avg annual change in HH resources as share of income 2026-2034 from OB3
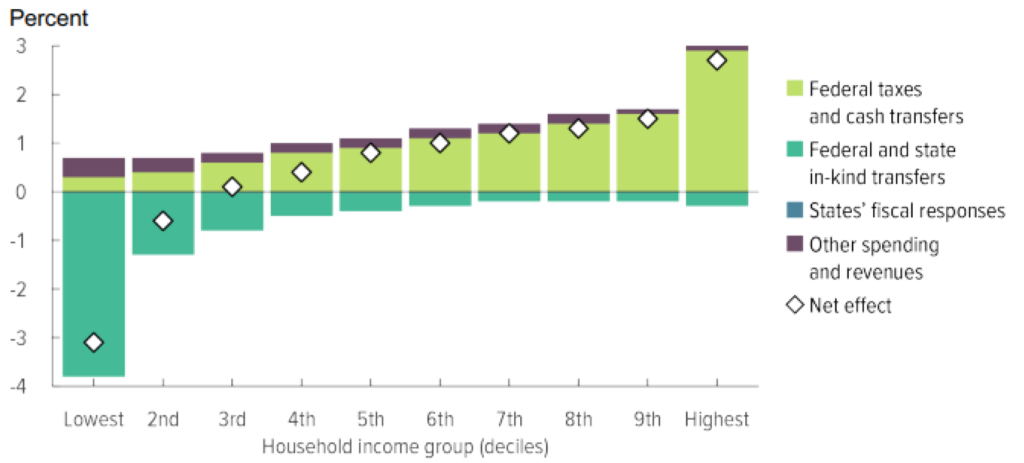
Note: Reflects household resources after transfers and taxes.
Sources: Congressional Budget Office, staff of the Joint Committee on Taxation, Santander US Capital Markets