


The Big Idea
From abundant to ample
Steven Abrahams | November 10, 2025
This material is a Marketing Communication and does not constitute Independent Investment Research.
Financing markets have delivered a few expensive surprises since mid-October. SOFR broke above the top end of the Fed’s target range on October 15 and 16 and again from October 27 through November 3 as demand for money stretched the supply. Liquidity in US markets has gone from abundant, by Fed design, to merely ample. But for observers concerned that liquidity is about to become scarce and financing rates more expensive and volatile, my colleague Jose Maria Fernandez argues it is too soon to ring the alarm bells.
The latest drama in repo
In the latest Rates Strategy Weekly (access required) published out of Madrid, Fernandez highlights the October 31 spike in SOFR that caught investors’ attention. The 4.22% SOFR rate put it 22 bp above the top end of the Fed’s target range and 32 bp above the interest on reserve balances paid by the Fed. SOFR had posted above the top of the Fed range by less than 5 bp a few other days in October, but this was a big one. SOFR has since dropped below the top end of the Fed range and close to IORB.
Exhibit 1: SOFR has posted higher than IORB lately and even above Fed target
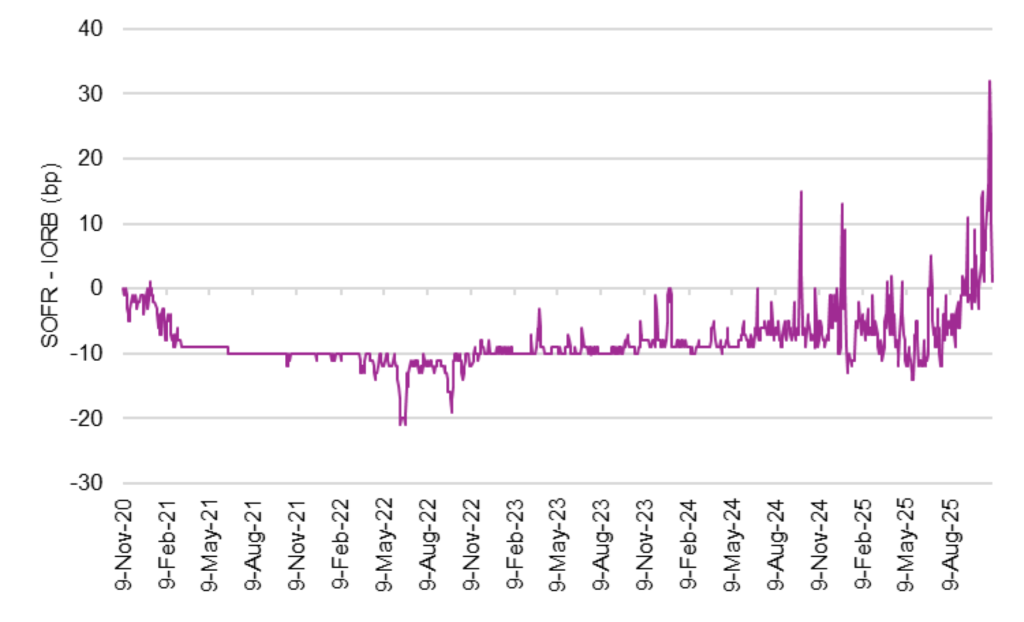
Source: Bloomberg, Santander US Capital Markets
The Fed’s Standing Repo Facility, set up in July 2021, was supposed to limit the risk that money market rates would breach the top end of the Fed range. The SRF provides daily overnight repo secured by US Treasury debt, agency debt and agency MBS. Primary dealers are counterparties to the SRF as are 43 banks and credit unions. The current SRF repo rate is 4.00%, the top of the Fed range. The SFR in theory becomes a source of money triggered when financing rates move above the SFR repo rate, bringing those financing rates down. The SRF looks like it buffered the stress on October 31, when counterparties borrowed $50 billion, but did not entirely relieve it. Counterparties borrowed $22 billion from the SRF the next business day with SOFR at 4.13%, helping drive SOFR a day later back to the top of the Fed range. SFR borrowing has since become minimal.
Exhibit 2: Dealers and banks borrowed $50 billion from the SRF on October 31
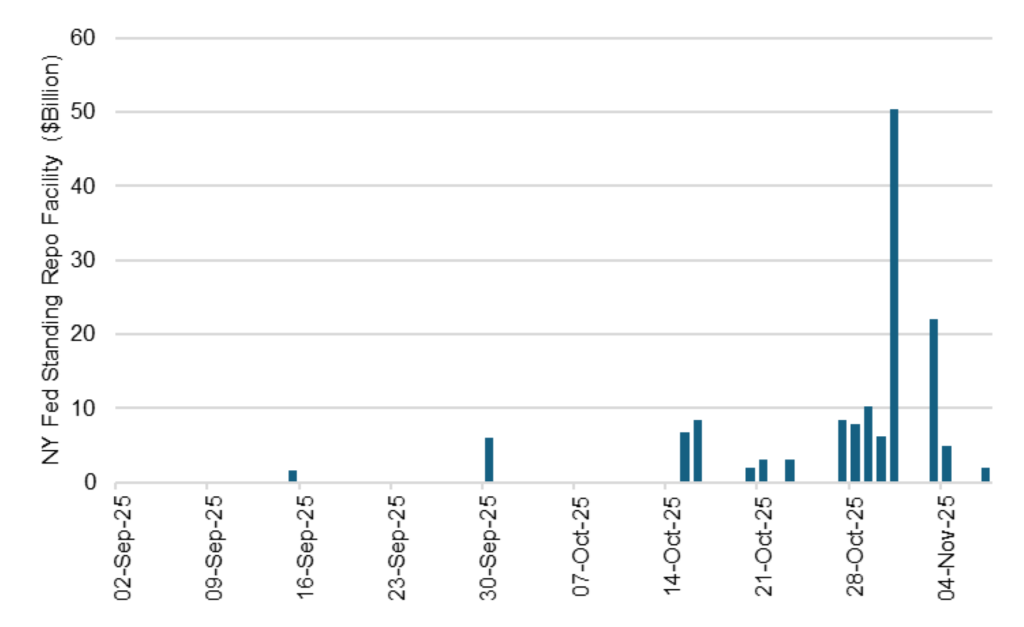
Source: Bloomberg, Santander US Capital Markets
Temporary, not structural
“The recent spike in overnight repo rates was caused by the combination of two situations: month-end stress plus a temporarily high ‘liquidity drain’ into the Treasury General Account,” Fernandez writes. SOFR has spiked regularly at the end of many months and quarters in recent years as banks pull back from repo to reduce the size of their balance sheets. October 31 also happens to be the end of the fiscal year for many banks in Canada, which provide significant funding to US repo markets. Fernandez points out that Treasury also has been on a binge of issuing T-bills to restock its supply of cash, drawing an estimated $500 billion in cash out of the financial system. Balances in the TGA now exceed the Treasury’s end-of-year $850 billion target by around $100 billion. As the TGA comes down, that should add back some cash. The normalization of the TGA balance, Fernandez notes, “should bring to a halt all recent concerns about scarce liquidity in the US financial system, at least in the short run.”
The response of money markets since mid-October in some way just reflects the long coming transition of liquidity from abundant to ample. The Fed’s overnight reverse repo facility has served as a floor on money market rates for cash outside the banking system while the higher IORB rate has served as a floor for cash inside the banking system. SOFR for most of the last five years as traded between the two. As QT has drawn down cash, balances at the Fed RRP have dropped toward zero and SOFR has started trading up toward IORB. This is exactly the kind of pattern the Fed has been watching for a signal of when to bring QT to a close. The December 1 timing looks right on target.
“Overnight repo rates are likely to remain more volatile, now moving more freely within the corridor that goes between the IORB and the upper end of the fed funds target range,” Fernandez expects. “But any spikes above the upper end of the target range, which is the cost of borrowing from the Fed’s overnight repo facility, should still be temporary one-offs related to month-end, quarter-end or year-end as we remain in a situation of ‘ample’ but not yet ‘scarce’ liquidity.”
If for some reason SOFR continues to break above the top end of the Fed target range, it could take a page from 2018 and 2019, according to Fernandez, when it pulled down IORB toward the low end of the target range. That would create new incentives for banks to push more reserves into the repo market and lower the risk of SOFR spikes. That would probably take SOFR and other money market rates closer to the mid-point of the range and lower the risk for trillions of dollars in financed positions of more expensive surprises.
* * *
The view in rates
Fed funds futures for the end of 2025 now signal some doubt about another cut in December, pricing funds roughly 6 bp above the Fed’s dot from September, a dot that implies another cut. My colleague Stephen Stanley says he wouldn’t be surprised by a December cut, although that that is not his base case. He continues to expect no more cuts through the first half of 2026 and possibly through the full year. Inflation is still running above the Fed target and labor markets are soft but not recessionary, making it hard for the Fed to cut very much.
Swap spreads starting in September have widened significantly in longer maturities and continued widening through October. The best theories give credit to a surge in tariff revenue to reduce Treasury supply with some help from hedge fund buying to add to Treasury demand. Tune into Supreme Court arguments on November 5 to see if the legal basis to many of those tariffs gets challenged.
Key market levels:
- Fed RRP balances settled on Friday at $5 billion, down $45 billion from a week ago, reflecting better lending opportunities in other repo markets
- Setting on 3-month term SOFR traded Friday at 384 bp, down 1 bp in a week
- Further out the curve, the 2-year note traded Friday at 3.56%, down 3 bp in the last week. The 10-year note traded at 4.10%, up 1 bp in the last week
- The Treasury yield curve traded Friday with 2s10s at 53 bp, steeper by 3 bp in the last week. The 5s30s traded Friday at 101 bp, steeper by 5 bp
- Breakeven 10-year inflation traded Friday at 229 bp, down 3 bp in the last week. The 10-year real rate finished the week at 180 bp, up 3 bp in the last week
The view in spreads
Credit markets remain nervous. Surging private debt, surging bank financing of private debt and the complexities of managing and monitoring the risk have led investors in riskier names to start re-underwriting some of the risk. The case for investment grade risk remains solid: Start with an easier Fed, add solid fundamentals for bigger business and higher income households, lower volatility, continuing inflows to credit buyers and relatively heavy Treasury supply. Those tides continue to flow. The Bloomberg US investment grade corporate bond index OAS traded on Friday at 82 bp, wider by 6 bp in a week. Nominal par 30-year MBS spreads to the blend of 5- and 10-year Treasury yields traded Friday at 123 bp, wider by 1 bp in the last week. Par 30-year MBS TOAS closed Friday at 24 bp, tighter by 2 bp.
The view in credit
The news from Zions Bancorp and Western Alliance Bancorp about possible fraud in loans to non-depository financial institutions raises questions about a line of lending that has expanded rapidly in the last few years. The competition and the complexity of monitoring the risk may be coming home to roost. This follows the news around Tricolor Holdings, in the business of selling used cars to subprime borrowers and financing them, now accused of fraud against warehouse lenders. The firm filed bankruptcy on September 9. Serious delinquencies in FHA mortgages and in credit cards held by consumers with the lowest credit scores have been accelerating. Consumers in the lowest tier of income look vulnerable, and renewed student payments and cuts to government programs should keep the pressure on. The balance sheets of smaller companies show signs of rising leverage and lower operating margins. Leveraged loans also are showing signs of stress, with the combination of payment defaults and liability management exercises, or LMEs, often pursued instead of bankruptcy, back to 2020 post-Covid peaks. If persistent inflation keeps the Fed at higher rates, fewer leveraged companies will be able to outrun interest rates, and signs of stress should increase. LMEs are very opaque transactions, so a material increase could make important parts of the leveraged loan market hard to evaluate.