


The Big Idea
Five theories of current US swap spreads
Steven Abrahams | October 31, 2025
This material is a Marketing Communication and does not constitute Independent Investment Research.
Treasury supply and demand has been on the move since the start of September, at least based on yield spreads between SOFR swaps and the Treasury curve. Swap spreads have widened in longer maturities, usually a signal of lower expected Treasury supply, rising demand or both. Of the handful of theories competing to explain it, tariffs and hedge funds may be the best.
Shifting swap spreads
US 10- and 30-year swap spreads have marched wider since the start of September and investors have started scrambling for explanations. The 10-year spread is out by 11 bp and the 30-year by 13 bp. Those are big moves. Spreads at shorter maturities have moved only a fraction with 5-year spreads out 4 bp and 2-year basically unchanged (Exhibit 1).
Exhibit 1: Swap spreads have widened noticeably since early September
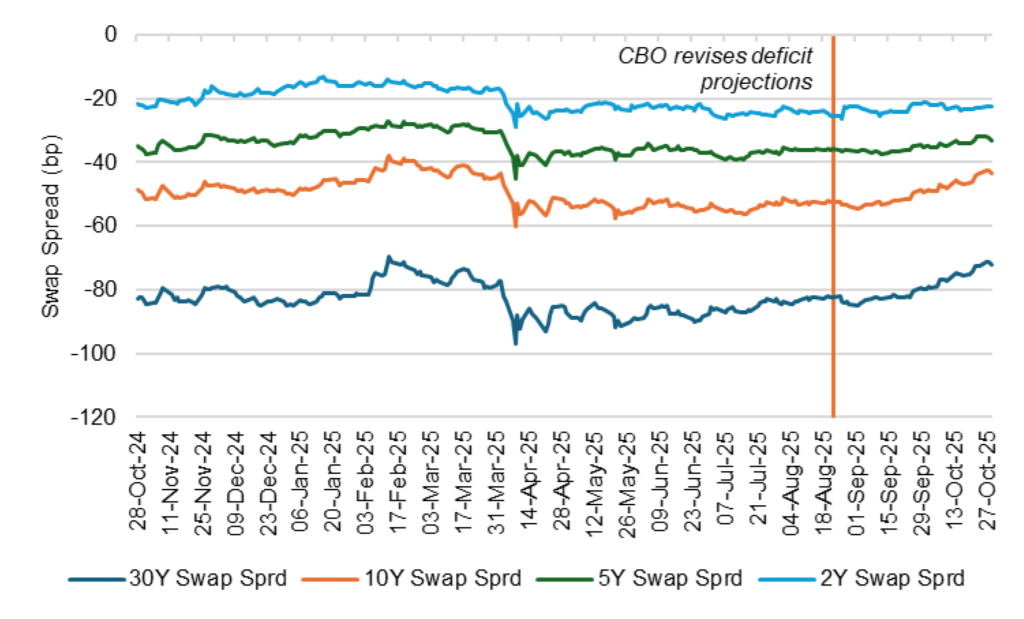
Source: Bloomberg, Santander US Capital Markets
Just as noticeably, swap spreads have moved back toward marks just before the April 2 Liberation Day, when the US announced reciprocal tariffs. The 10-year spread matches Liberation Day levels, the 30-year spread is 5 bp wider. Shorter maturities are a little different. The 5-year spread is 3 bp tighter, the 2-year spread 5 bp tighter.
Liberation Day is an important benchmark. Rising rates in the US against falling rates in Germany and elsewhere, falling value in the US dollar against rising value in other currencies and weaker equity market performance in the US suggested capital rotated out of the US in April. Subsequent reports from the Treasury International Capital System confirmed small net outflows from Treasury debt that month, although those reversed in May and in months since.
A benchmark for shifting supply and demand
Beyond moment-to-moment or day-to-day moves triggered by hedging, swap spreads should measure changes in the balance of supply and demand for Treasury debt. Since both curves arguably are the least risky benchmark for US debt—the Treasury curve because of US government backing and the swap curve because of a floating leg tied to fed funds—both should respond the same way to fundamentals such as inflation or the real rate for money. That leaves supply and demand. Since Treasury debt is limited by the US Treasury and swaps only by the willingness of thousands of swap counterparties to trade, most of the changes in spreads should speak to Treasury supply and demand.
Investors have started looking for reasons why either expected Treasury demand has increased since early September, expected supply decreased or both. At least five theories are in the mix
- Tariff revenue will reduce Treasury supply
- Hedge fund momentum is pushing spreads
- The end of Fed QT will increase Treasury demand
- The US will add short-maturity supply, reduce long-maturity
- Changing bank regulation could add to Treasury demand
Theory 1: Tariffs will reduce US deficits and Treasury supply
Tariffs have turned out to be a geyser of new federal revenue, enough to lead the Congressional Budget Office on August 22 to estimate they will reduce cumulative US deficits over the next decade by $4.0 trillion. For context, the CBO currently projects a fiscal 2026 deficit of $2.2 trillion. Another $400 billion in customs revenue would cut that number by 18%. That amount of revenue over the next year seems entirely plausible. Customs revenue has averaged $31.6 billion a month from August into October, or an annualized $379 billion (Exhibit 2).
Exhibit 2: Tariffs have lifted US customs revenue to around $31 billion a month
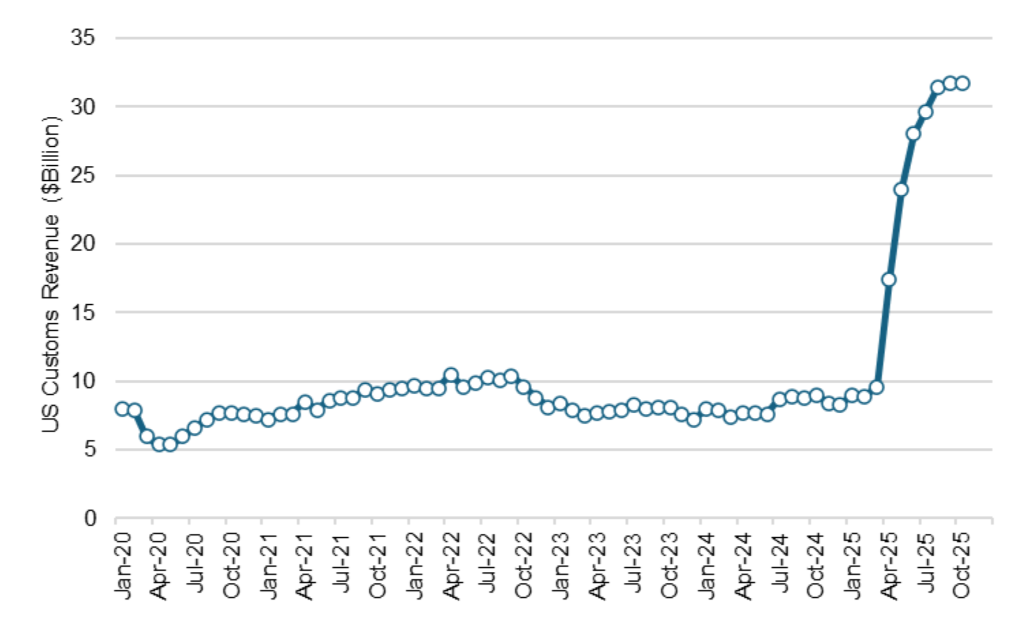
Source: Bloomberg, Santander US Capital Markets
The August 22 CBO estimate is notable for its timing and its contrast with a June 4 estimate. Spreads started widening shortly after the August report, and customs revenues have stayed high. The CBO also revised the projected tariff impact on deficits over the next decade from $3.0 trillion in June to $4.0 trillion in August. The June 4 estimate came before the US imposed 50% tariffs on steel, aluminum and copper, 40% tariffs on Brazil and 25% tariffs on India. The initial 90-day pause on reciprocal tariffs also was still in place in June, so investors may have had doubts about their longevity. By August 22, investors could see the potential for sustained higher customs revenues.
This looks like the strongest theory of the current widening in spreads. The August 22 timing is right. The customs revenues are a bit of a surprise. And spreads have moved in the direction predicted by falling supply.
This theory could get tested soon by the Supreme Court. It will hear arguments on November 5 challenging the ability of the president to use the International Economic Emergency Powers Act to impose many of the current tariffs. If the arguments suggest the court might side with the administration and allow the tariffs to stay in place or even expand, that could reduce supply and widen spreads further. It is worth noting that Polymarket gives less than a 40% chance to a Supreme Court ruling in favor of the administration.
Theory 2: Hedge funds are pushing the trade
Numbers from the Chicago Mercantile Exchange suggest hedge funds since mid-March may have bought up to $108 billion of 10-year notes, heroically assuming funds bought notes against short positions in futures (Exhibit 3). The added demand could help widen swap spreads, which has been happening slowly since shortly after Liberation Day. But from late August to September 23, hedge fund short positions actually declined by $3 billion. Hedge funds may have been indirectly pushing spreads for months, but it’s a thin case that they’ve had a big role since September. Still, give some credit to this theory for the trend in spreads.
Exhibit 3: Short positions in 10-year futures imply hedge fund demand for notes
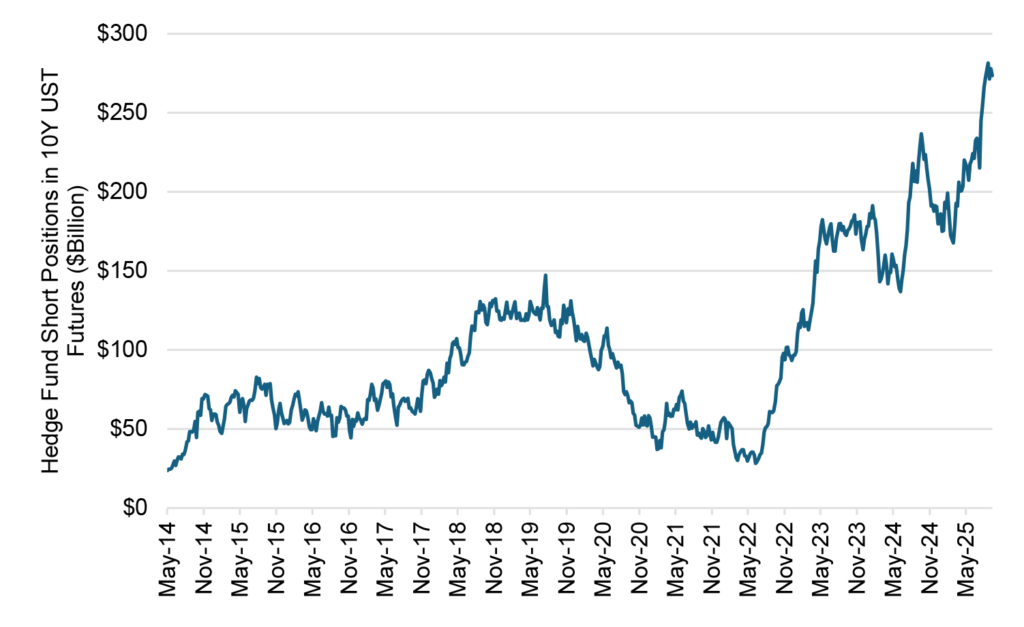
Source: Office of Financial Research, Santander US Capital Markets
Theory 3: The end of QT will increase Treasury demand
The Fed gave this one to the market with the October FOMC by announcing a December 1 end to QT, but maybe some in the market anticipated it and decided to buy Treasury debt ahead of increased demand from the SOMA portfolio. More demand, wider spreads.
I’m skeptical about this one. The market has debated an imminent end to QT since it started in 2022. It is true that spikes over the last year in repo rates at month- and quarter-end have signaled possible funding stress from falling reserves. This is the kind of thing the Fed watches to know when to stop QT. But it seems heroic to assume that something happened around the start of September to give investors new conviction.
The news itself, however, turns out to be a spread tightener. The intention to reinvest runoff in T-bills takes Fed demand out of most of the curve. Longer spreads did initially tighten on the news.
Theory 4: The US will shift Treasury supply
Treasury Secretary Scott Bessent has spoken often about lowering the cost of US debt service by shifting issuance to the front of the yield curve, and maybe some investors became convinced in early September to lean into this possibility. That would raise Treasury supply in the front end of the curve and lower it in the back end. That would tighten spreads in the front end, widen spreads in the back.
Call me a skeptic on this one, too. Bessent has talked this talk since before coming into office but has roughly kept the same debt mix as his predecessor. Its possible things will change with the next refunding announcement, but it’s not clear why market convictions about a change in debt mix would strengthen in early September.
Theory 5: Bank reform will increase Treasury demand
Bank regulators in late June proposed changing capital rules to make it easier for banks to hold Treasury debt, which would raise Treasury demand. This was not necessarily new. Analysts have suggested these sorts of changes for years. Of course, the actual proposal raises the possibility of actual change. This should widen swap spreads.
Although the direction of travel on bank reform is consistent with tighter spreads, the timing is off. It may be that something happened in early September to further raise the possibility of change or accelerate it, but it’s not obvious.
Nothing more practical than a good theory
My colleague, Antonio Villarroya, points to a few other things in the mix. One big fundamental is that nominal growth has come in stronger than initially feared after Liberation Day. That also would reduce the deficit and supply, but it is likely more relevant to trend than to the September moves. And he notes the Treasury increasingly has been buying back longer debt, a widener at longer maturities.
For my money, the tariff theory and the hedge fund theory look the most plausible, at least for this recent round of Treasury debt richening to the swap curve. The practical implication is that an important piece of Treasury supply should depend on the arc of tariffs, and an important piece of demand on the profitability of the Treasury basis trade. At the very least, that should mean some volatility in swap spreads on November 5 when the Supreme Court hears the case for presidential power over tariffs. The direction of spreads could turn on that.
* * *
The view in rates
The fed funds market apparently has listened to Fed Chair Powell after the FOMC, noted Governor Schmid’s hawkish dissent and listened to remarks since from Governors Logan and Hammack. Another cut in December is not a foregone conclusion, as Powell said, and several governors opposed the last cut. As a result, fed funds futures for the end of 2025 now signal some doubt about another cut in December, pricing funds roughly 8 bp above the Fed’s dot from September, a dot that implies another cut. My colleague Stephen Stanley continues to expect no more cuts through the first half of 2026. Inflation is still running above the Fed target, making it hard for the Fed to cut very much.
Swap spreads starting in September have widened significantly in longer maturities and continued widening through October. As outlined in detail before, the best theories give credit to a surge in tariff revenue to reduce Treasury supply with some help from hedge fund buying to add to Treasury demand. Tune into Supreme Court arguments on November 5 to see if the legal basis to many of those tariffs gets challenged.
Key market levels:
- Fed RRP balances settled on Friday at $52 billion, up $50 billion from a week ago. Chalk that up to the end of the month, when banks pare back on matched book repo financing and force cash to the RRP
- Setting on 3-month term SOFR traded Friday at 385 bp, down 1 bp in a week
- Further out the curve, the 2-year note traded Friday at 3.59%, up 11 bp in the last week. The 10-year note traded at 4.09%, up 9 bp in the last week
- The Treasury yield curve traded Friday with 2s10s at 50 bp, flatter by 2 bp in the last week. The 5s30s traded Friday at 96 bp, flatter by 3 bp
- Breakeven 10-year inflation traded Friday at 232 bp, up 2 bp in the last week. The 10-year real rate finished the week at 177 bp, up 7 bp in the last week
The view in spreads
Credit markets remain nervous. Surging private debt, surging bank financing of private debt and the complexities of managing and monitoring the risk have led investors in riskier names to start re-underwriting some of the risk. The case for investment grade risk remains solid: Start with an easier Fed, add solid fundamentals for bigger business and higher income households, lower volatility, continuing inflows to credit buyers and relatively heavy Treasury supply. Those tides continue to flow. The Bloomberg US investment grade corporate bond index OAS traded on Friday at 76 bp, tighter by 1 bp in a week. Nominal par 30-year MBS spreads to the blend of 5- and 10-year Treasury yields traded Friday at 122 bp, wider by 1 bp in the last week. Par 30-year MBS TOAS closed Friday at 26 bp, wider by 1 bp.
The view in credit
The news from Zions Bancorp and Western Alliance Bancorp about possible fraud in loans to non-depository financial institutions raises questions about a line of lending that has expanded rapidly in the last few years. The competition and the complexity of monitoring the risk may be coming home to roost. This follows the news around Tricolor Holdings, in the business of selling used cars to subprime borrowers and financing them, now accused of fraud against warehouse lenders. The firm filed bankruptcy on September 9. Serious delinquencies in FHA mortgages and in credit cards held by consumers with the lowest credit scores have been accelerating. Consumers in the lowest tier of income look vulnerable, and renewed student payments and cuts to government programs should keep the pressure on. The balance sheets of smaller companies show signs of rising leverage and lower operating margins. Leveraged loans also are showing signs of stress, with the combination of payment defaults and liability management exercises, or LMEs, often pursued instead of bankruptcy, back to 2020 post-Covid peaks. If persistent inflation keeps the Fed at higher rates, fewer leveraged companies will be able to outrun interest rates, and signs of stress should increase. LMEs are very opaque transactions, so a material increase could make important parts of the leveraged loan market hard to evaluate.