


The Big Idea
Tricolor, First Brands and the shifting shape of credit
Steven Abrahams | October 24, 2025
This material is a Marketing Communication and does not constitute Independent Investment Research.
The Tricolor and First Brands bankruptcies and news of loan losses at Western Alliance and Zions bank have made credit markets nervous. Each case involves loans secured through an intermediary by a complex asset. Banks made loans to Tricolor secured by subprime auto loans. First Brands lenders possibly missed off-balance-sheet debt secured by receivables. And Western Alliance and Zions made loans to a commercial real estate investment firm that reportedly subordinated them to other lenders. Lending through intermediaries by US commercial banks, among others, has far outstripped more traditional direct lending in recent years. For credit investors, the issue is whether growth has outstripped ability to manage and monitor it.
A surge in lending to non-bank financial institutions
US commercial banks in recent years have significantly increased lending to investment firms, funds and other non-bank financial institutions. In the last year alone, loans to NBFI have jumped nearly 46%. This compares to total asset growth of 4%, real estate growth of 1.3% and to contraction in consumer lending of 4.3% and C&I lending of 4.6% (Exhibit 1). Over 3- and 5-year horizons, NBFI lending has grown at least five times as fast as other bank credit.
Exhibit 1: Lending to NBFI has expanded faster than any other line of bank credit
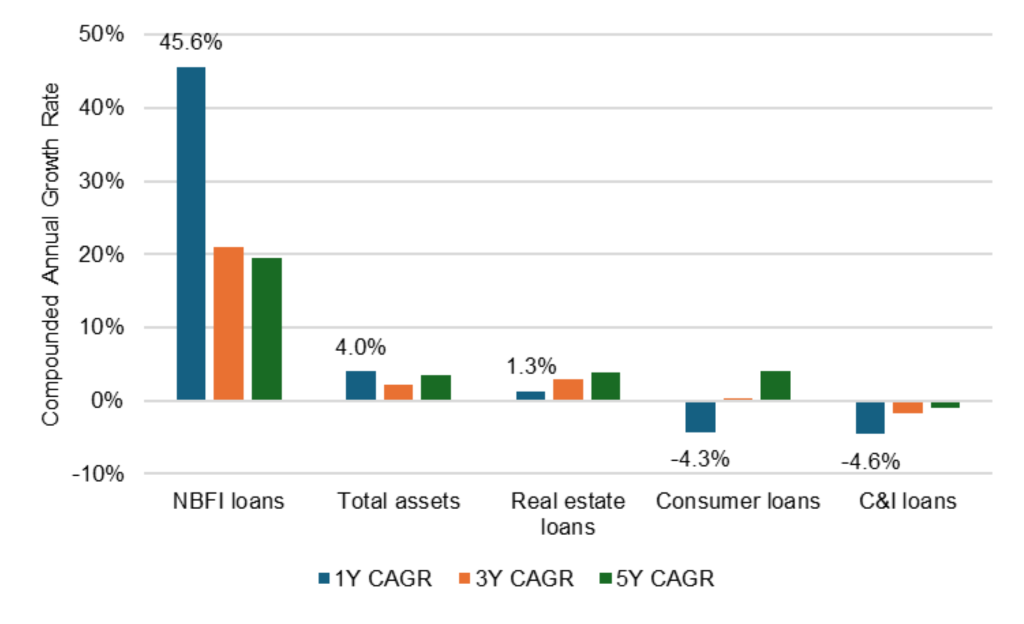
Note: Growth rates at domestically chartered US commercial banks.
Source: Federal Reserve H.8, Santander US Capital Markets
It is possible that the surge in NBFI lending reflects a surge in net new credit demand, but it is more likely banks are ceding roles as direct lender to NBFI and lending to the NBFI instead. The growth in NBFI lending along with slow growth in real estate loans and shrinking books of consumer and C&I loans seems consistent with a change in roles. Looking beyond bank balance sheets alone, the 1-year rate of growth in aggregate lending from all sources suggests the same (Exhibit 2). According to the Fed’s Financial Accounts of the United States, lending to foreign borrowers, to other financial business—such as investment funds or other business that are not depositories or insurers—and to broker/dealers has grown by nearly 20% or more in the last year (Exhibit 2). Lending to depositories, insurers, nonfinancial business, households, mortgage REITs and others has grown at a much slower pace. Demand for credit from traditional direct borrowers has gone up a little, but demand from borrowers that might in turn become lenders has gone up much faster. Nicola Cetorelli at the New York Fed also has argued that banks have migrated from direct lending to lending to NBFI intermediaries.
Exhibit 2: Credit demand has gone up fast for intermediaries, slowly for others
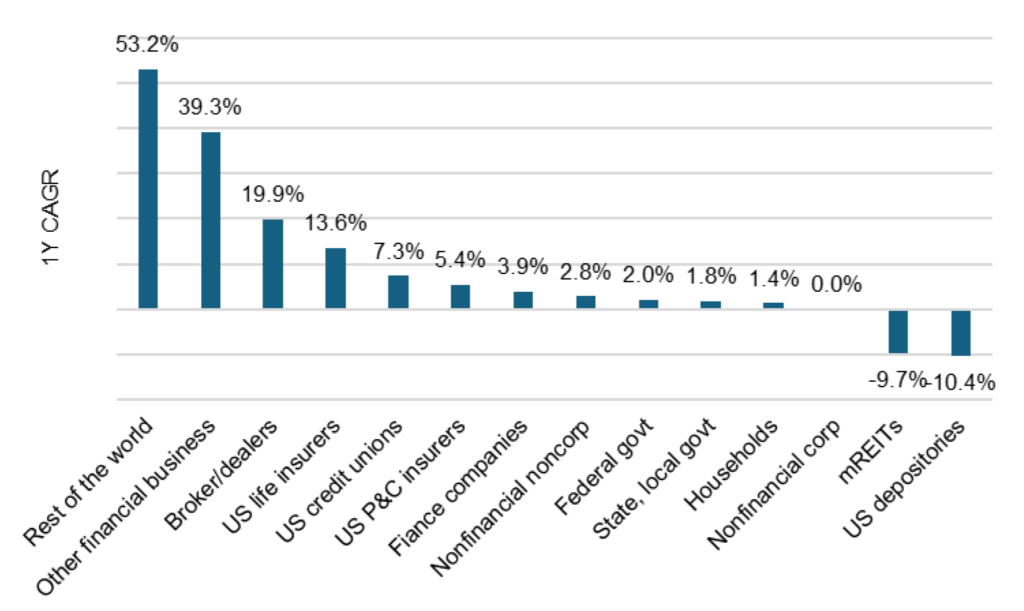
Source: Federal Reserve Financial Accounts of the United States, Table L.214, Santander US Capital Markets
The growth in NBFI lending has come from banks of all sizes, although larger banks have grown faster. In the last year through June, for instance, banks with $100 billion or more in total assets have grown NBFI lending by 45.2%, banks with $50 billion to $100 bill by 27.4% and banks with $10 billion to $50 billion by 33.3% (Exhibit 3). In each case, that growth is at least 4.5 times as fast as overall asset growth.
Exhibit 3: Large banks lead NBFI growth, but all outpace total asset growth

Note: Growth rates at domestically chartered US commercial banks.
Source: S&P Capital IQ, Santander US Capital Markets
NBFI lending consequently is no longer a niche bank exposure. NBFI lending at domestically chartered commercial banks now approaches $1.3 trillion or 6% of total assets (Exhibit 4). That trails $5.6 trillion in real estate loans, $2.1 trillion in C&I and $1.8 trillion in consumer loans. But those numbers do not include unused lending commitments. At the end of June, according to bank regulatory filing, unused commitments to NBFI stood at $941 billion. If NBFI fully drew those commitments today, total exposure would approach $2.2 trillion or 10% of total assets.
Exhibit 4: NBFI now make up 6% of total assets

Note: Domestically chartered US commercial banks.
Source: Federal Reserve H.8. as of 10/8/2025.
The New York Fed’s Cetorelli argues the shift in direct lending from banks to NBFI reflects banks’ higher regulatory and supervisory costs. To add a riskier loan, the bank has to cover higher costs. That let’s the NBFI undercut bank pricing and attract direct lending. The NBFI then buys leverage from the bank, but bank pricing does not build in enough marginal risk from the lighter NBFI regulatory and supervisory regime to offset the NBFI initial cost advantage. NBFI grow, and bank lending to them follows.
The complexity of indirect exposure
The complexity in lending to NBFI comes from adding a layer between the bank and the collateral needed to repay the loan. With Tricolor, it was Tricolor as intermediary between the bank and the auto collateral. With First Brands, it was the company as intermediary between lender and the receivables. With Western Alliance and Zions, it was the investment fund as intermediary. Lending to NBFI extends the chain of agents between the principal lender and the collateral. The more links in the chain, the greater the likelihood of gaps in information where risks that might seem clear to the direct lender do not get passed along to the bank. More links also raise the risk of differences in incentives, where the direct lender may put more emphasis on managing costs and raising volume than on portfolio diversification and loan performance alone. Tricolor, First Brands, and Western Alliance and Zions all look like instances.
Lenders, of course, have long had ways to manage these risks, and Dodd-Frank reforms after the Global Financial Crisis put many of them into law for securitizations. The most important ones align the agent with the principal. The NBFI might take the equity position in the direct lending loan portfolio, may agree to limits on underwriting, may agree to diversity the portfolio along important risk measures, may appoint a custodian to verify the loans, may have credit performance triggers and so on. But it is arguably more complex than controlling the underwriting directly, creating room for error or misalignment.
One example might be forward flow agreements, where a specialty loan originator agrees to deliver future production to a NBFI. Even through the NBFI may have equity in the resulting loan portfolio, the originator may not retain risk. The originator consequently may have stronger incentives to produce volume than quality. A bank lender to the NBFI might see the portfolio equity, but the misalignment of incentives with the originator may be harder to see.
The pace of growth raises the possibility that the experience and systems needed for this kind of lending have not scaled as fast as the lending itself. The latest news has raised the possibility, but there is no obvious evidence for now of a broader problem. The rate of noncurrent loans to NBFI, for example, runs well below other lines of lending such as C&I or consumer. Of the 4,133 commercial banks captured by S&P Capital IQ as of June, only 408 reported noncurrent rates on NBFI higher than both C&I and consumer loans. Of course, many of these NBFI loans are relatively new and untested by time or circumstance.
Bank regulators have noticed the growth. The New York Fed has an entire webpage devoted to understanding and engaging with NBFIs. And the International Monetary Fund highlighted NBFI exposure in its latest Global Financial Stability Report. Attention from regulators usually translates into attention from bank management, especially to make sure the bank can tick off the measures in place to ensure the interests of the NBFI are aligned with the interests of the bank. Anecdotally, regulator interest in those measures is only increasing, which could affect availability of NBFI credit at different times or at different banks.
This credit story will likely unfold in pieces. If the economy booms next year, the links in the chain between lender and collateral may not get tested. But if the economy slows, credit markets should get a clearer view of how well banks have managed and monitored the principal-agent challenges of NBFI loans. It may be fine to call Tricolor, First Brands and the loans made by Western Alliance and Zions idiosyncratic for now. It will almost surely take systematic stress to see if they are more than that.
* * *
The view in rates
Fed funds futures for the end of 2025 now roughly match the Fed median dot from the September FOMC and fall 46 bp below the median dot for the end of 2026. That leaves the Fed and market both expecting two more cuts this year, the Fed expecting one more in 2026 and the market expecting three more next year. My colleague Stephen Stanley is much less bullish. Inflation is still running above the Fed target, making it hard for the Fed to cut very much. He looks for one more cut in 2025 and then a Fed on hold through mid-2026.
Steady political pressure on the Fed and the background risk of rising US federal deficits should leave rates in the long end lagging any decline in shorter rates. The 2s10s curve should steepen.
Swap spreads starting in September have widened significantly in longer maturities and continued widening through October. Some analysts argue that Treasury plans to move issuance into bills is prompting a grab for longer debt and consequently widening spreads. Swap spreads have widened in Germany, too, but it is possible that demand for longer US sovereign debt could spill over into other markets.
Key market levels:
- Fed RRP balances settled on Friday at $2 billion, down $2 billion from a week ago
- Setting on 3-month term SOFR traded Friday at 386 bp, down 2 bp in a week
- Further out the curve, the 2-year note traded Friday at 3.48%, up 2 bp in the last week. The 10-year note traded at 4.00%, unchanged in the last week
- The Treasury yield curve traded Friday with 2s10s at 52 bp, flatter by 3 bp in the last week. The 5s30s traded Friday at 99 bp, flatter by 2 bp
- Breakeven 10-year inflation traded Friday at 230 bp, up 3 bp in the last week. The 10-year real rate finished the week at 170 bp, down 4 bp in the last week
The view in spreads
The case for tight spreads in better credits and in MBS continues, although credit markets have become nervous. Start with an easier Fed, add solid fundamentals for bigger business and higher income households, lower volatility, continuing inflows to credit buyers and relatively heavy Treasury supply. Those tides continue to flow. But spreads in smaller or more leveraged corporate balance sheets or lower-income households may widen on weaker fundamentals. The Bloomberg US investment grade corporate bond index OAS traded on Friday at 77 bp, wider by 1 bp in a week. Nominal par 30-year MBS spreads to the blend of 5- and 10-year Treasury yields traded Friday at 121 bp, unchanged in the last week. Par 30-year MBS TOAS closed Friday at 25 bp, wider by 1 bp.
The view in credit
The news from Zions Bancorp and Western Alliance Bancorp about possible fraud in loans to non-depository financial institutions raises questions about a line of lending that has expanded rapidly in the last few years. The competition and the complexity of monitoring the risk may be coming home to roost. This follows the news around Tricolor Holdings, in the business of selling used cars to subprime borrowers and financing them, now accused of fraud against warehouse lenders. The firm filed bankruptcy on September 9. Serious delinquencies in FHA mortgages and in credit cards held by consumers with the lowest credit scores have been accelerating. Consumers in the lowest tier of income look vulnerable, and renewed student payments and cuts to government programs should keep the pressure on. The balance sheets of smaller companies show signs of rising leverage and lower operating margins. Leveraged loans also are showing signs of stress, with the combination of payment defaults and liability management exercises, or LMEs, often pursued instead of bankruptcy, back to 2020 post-Covid peaks. If persistent inflation keeps the Fed at higher rates, fewer leveraged companies will be able to outrun interest rates, and signs of stress should increase. LMEs are very opaque transactions, so a material increase could make important parts of the leveraged loan market hard to evaluate.