


The Big Idea
Demand for credit kinda looks like an annuity
Steven Abrahams | October 17, 2025
This material is a Marketing Communication and does not constitute Independent Investment Research.
An important part of the story of narrowing risk premiums in US credit revolves around steady demand from US life insurers. Lifers at the end of June held 23% of outstanding corporate and structured debt securities, according to the Fed, the largest share of any type of domestic investor. Much of the demand comes from a shift in business from traditional life insurance toward annuities, which pair best against assets with stable cash flows and yield. Annuities should keep feeding credit demand unless a sharp drop in rates brings the annuity boom to an end.
A growing business in annuities
Annuity sales have nearly doubled since the Fed first raised interest rates in 2022, most of the growth coming from fixed annuities (Exhibit 1). Fixed annuities guarantee principal and offer a minimum rate of interest. These stable annuities contrast with variable annuities, which make distributions based on performance of a portfolio of stocks and vary with the market. Indexed annuities look like a hybrid of fixed and variable, offering a minimum rate and distributions linked to a stock index. Rising US interest rates since 2022 have widened the appeal of fixed annuities, allowing insurers to invest annuity principal in debt portfolios with much higher yield and offer higher minimum annuity rates.
Exhibit 1: Annuity sales have roughly doubled since early 2022
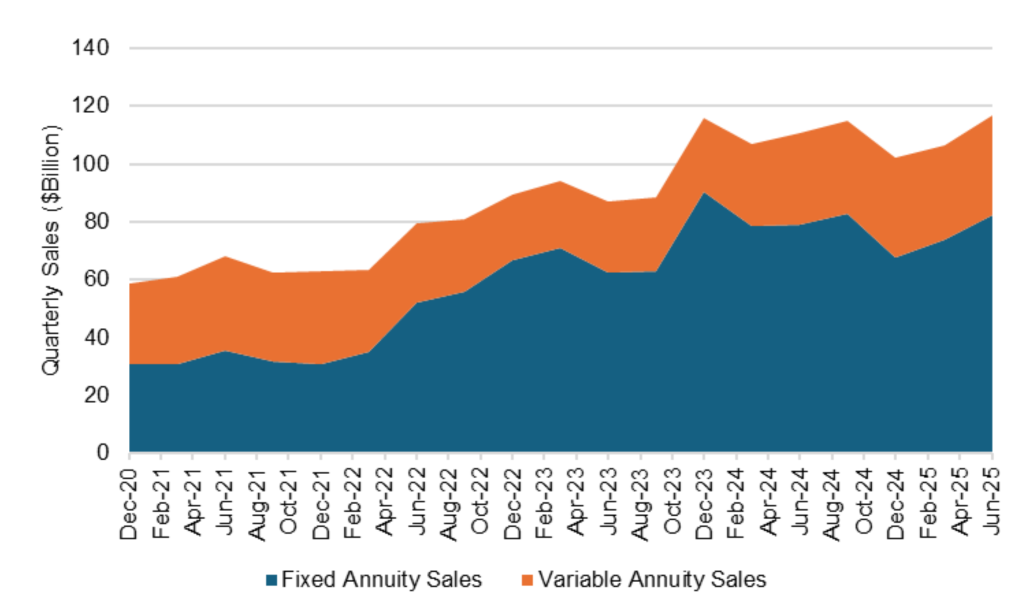
Source: LIMRA, Bloomberg, Santander US Capital Markets
Not surprisingly, rising sales have made annuities more important for life insurers. Annuities went from contributing 48.4% of direct premiums written in 2022 to 55.8% last year, taking share equally from more traditional accident and health insurance and from traditional life (Exhibit 2).
Exhibit 2: Annuities contribute a rising share of insurer premium income

Source: Insurance Information Institute, Santander US Capital Markets
The result has been rapid growth in assets managed against fixed annuities. At the end of 2024, lifers held $722 billion against fixed annuities (Exhibit 3). Since 2016, assets managed against fixed annuities have grown at a compounded annual rate of 6%, nearly twice the pace of assets held against variable annuities.
Exhibit 3: At the end of 2024, managed $722 billion against fixed annuities
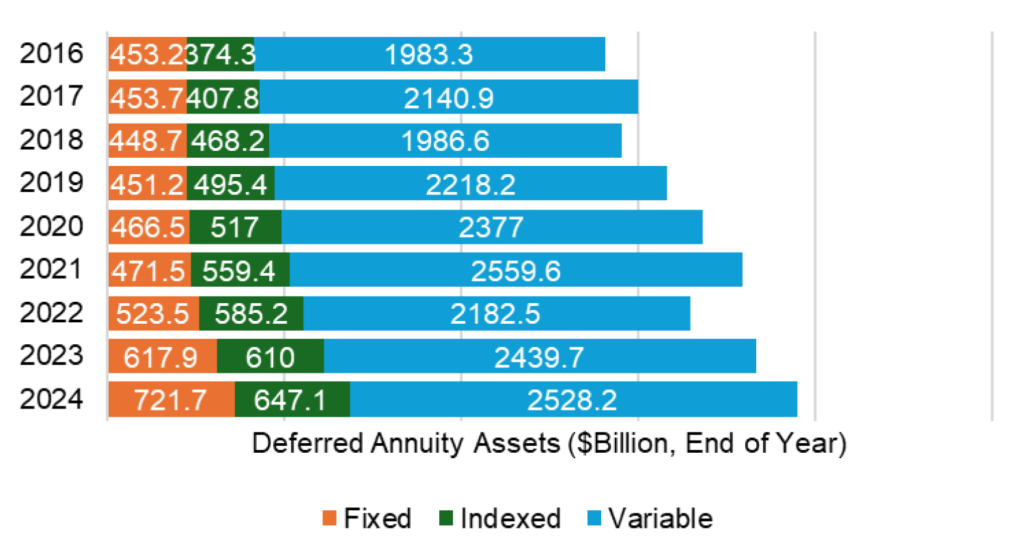
Note: US individual annuities.
Source: Insurance Information Institute, Santander US Capital Markets
The annuity business is at least modestly spread out across a long list of insurers. The Top 10 writers of annuity premiums last year captured 49% of the market, leaving a tail of business to other writers across the industry (Exhibit 4).
Exhibit 4: The Top 10 annuity writers in 2024 captured a 49% share

Source: Insurance Information Institute, Santander US Capital Markets
Annuities favor convex debt with spread
Funds from fixed annuities have raised demand for credit because they usually work best against assets with convexity and yield. That comes from a routine feature of fixed annuities: the ability of buyers to get their money back early.
Most annuities allow the buyer to withdraw annuity principal early, although surrender charges usually apply. Those charges typically start high in early years and step down over time. Some contracts allow the owner to withdraw a minimum amount of principal, such as 10%, without a surrender charge. Declining or no surrender charges usually mean buyers tend to redeem annuities more often when interest rates rise and allow buyers to replace an old annuity with a new one paying a higher rate. Just as the insurer gets the chance to reinvest at higher rates and take out more spread against the lower cost of annuity funds, the annuity tends to disappear. As rates fall, however, buyers tend to hold onto their old annuities. That exposes the insurer to reinvesting at lower rates while the relatively expensive annuity funds stay in place. The average life of a pool of annuities consequently gets shorter as rates rise and longer as rates fall, making it a negatively convex source of funding for the insurer.
The relatively long expected average life and negative convexity of annuities as a funding source give insurers incentive to match them with assets that pay a spread to the guaranteed annuity rate, that match the annuity duration and that have positive convexity to offset the annuity’s negative convexity. That broadly describes corporate and parts of structured credit such as CMBS or data center ABS, which is why annuity sales matter for investor demand in those sectors.
Annuities do not suit all risk assets, of course. MBS often makes a poor match to annuity funding since the average life of MBS gets longer as rates rise and gets shorter as rates fall. Matching negatively convex MBS against negatively convex fixed annuities doubles down on portfolio convexity risk. That’s likely the reason life insurer holdings in MBS over the last year have grown more slowly than holdings in corporate credit (Exhibit 5).
Exhibit 5: Life insurer corporate exposure has grown faster than MBS, ABS

Source: Federal Reserve Z1 Table L.116.g, Santander US Capital Markets
Annuity buyers’ ability to redeem principal also puts a limit on exposure to illiquid assets, although illiquid assets have the appeal of higher yield. Annuity managers need to hold enough liquidity to meet demand for potential redemptions. Depending on the schedule of surrender charges, illiquid assets that amortize might strike the right balance between yield and liquidity by returning principal and allowing reinvestment in steadily more liquid assets. Nevertheless, the issue of illiquidity has not stopped life insurers from moving a rising share of investments into 144A and other true private debt, a trend that started well before the current annuity boom (Exhibit 6).
Exhibit 6: Life insurers keep adding to private debt exposure
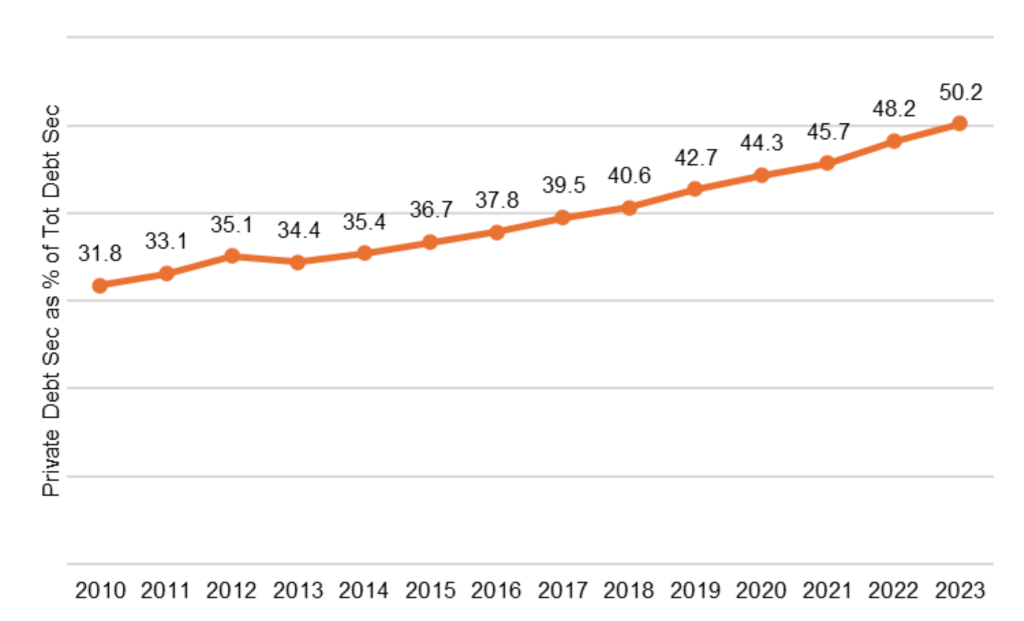
Source: CreditSights, Santander US Capital Markets
The risk to annuity-fueled demand for credit exposure
Life insurers for now look set to continue competing for assets that allow them to offer the annuity market the highest guaranteed rate at least within the bounds of the negatively convex annuity funding. If history is any guide, the clearest risk to that demand would come from a drift toward the lower rates in place before the Fed started to hike in 2022. That does not look likely for now. The Fed may help bring down rates broadly and especially in the front end of the yield curve, but US and global fiscal deficits look likely to put a drag on any quick decline in longer rates. Even if longer rates do decline, a new army of annuity writers and marketers look likely to keep sales rolling longer than rates alone might suggest, adding at least some momentum to demand for credit.
* * *
The view in rates
Fed funds futures for the end of 2025 now roughly match the Fed median dot from the September FOMC and fall 51 bp below the median dot for the end of 2026. That leaves the Fed and market both expecting two more cuts this year, the Fed expecting one more in 2026 and the market expecting three more next year. My colleague Stephen Stanley is much less bullish. Inflation is still running above the Fed target, making it hard for the Fed to cut very much. He looks for one more cut in 2025 and then a Fed on hold through mid-2026.
Steady political pressure on the Fed and the background risk of rising US federal deficits should leave rates in the long end lagging any decline in shorter rates. The 2s10s curve should steepen.
Key market levels:
- Fed RRP balances settled on Friday at $4 billion, down $4 billion from two weeks ago
- Setting on 3-month term SOFR traded Friday at 388 bp, down 5 bp in two weeks
- Further out the curve, the 2-year note traded Friday at 3.46%, down 11 bp in the last two weeks. The 10-year note traded at 4.00%, down 10 bp in two weeks
- The Treasury yield curve traded Friday with 2s10s at 55 bp, steeper by 1 bp in two weeks. The 5s30s traded Friday at 101 bp, unchanged
- Breakeven 10-year inflation traded Friday at 227 bp, down 7 bp in two weeks. The 10-year real rate finished the week at 174 bp, down 3 bp in two weeks
The view in spreads
The case for tight spreads in better credits and in MBS continues. Start with an easier Fed, add solid fundamentals for bigger business and higher income households, lower volatility, continuing inflows to credit buyers and relatively heavy Treasury supply. Those tides continue to flow. Spreads in smaller or more leveraged corporate balance sheets or lower-income households may widen on weaker fundamentals. The Bloomberg US investment grade corporate bond index OAS traded on Friday at 76 bp, wider by 6 bp in two weeks. Nominal par 30-year MBS spreads to the blend of 5- and 10-year Treasury yields traded Friday at 121 bp, wider by 1 bp in two weeks. Par 30-year MBS TOAS closed Friday at 24 bp, unchanged in the last two weeks.
The view in credit
The news from Zions Bancorp and Western Alliance Bancorp about possible fraud in loans to non-depository financial institutions raises questions about a line of lending that has expanded rapidly in the last few years. The competition and the complexity of monitoring the risk may be coming home to roost. This follows the news around Tricolor Holdings, in the business of selling used cars to subprime borrowers and financing them, now accused of fraud against warehouse lenders. The firm filed bankruptcy on September 9. Serious delinquencies in FHA mortgages and in credit cards held by consumers with the lowest credit scores have been accelerating. Consumers in the lowest tier of income look vulnerable, and renewed student payments and cuts to government programs should keep the pressure on. The balance sheets of smaller companies show signs of rising leverage and lower operating margins. Leveraged loans also are showing signs of stress, with the combination of payment defaults and liability management exercises, or LMEs, often pursued instead of bankruptcy, back to 2020 post-Covid peaks. If persistent inflation keeps the Fed at higher rates, fewer leveraged companies will be able to outrun interest rates, and signs of stress should increase. LMEs are very opaque transactions, so a material increase could make important parts of the leveraged loan market hard to evaluate.