


The Big Idea
Returns since June offer a blueprint through December
Steven Abrahams | October 3, 2025
This material is a Marketing Communication and does not constitute Independent Investment Research.
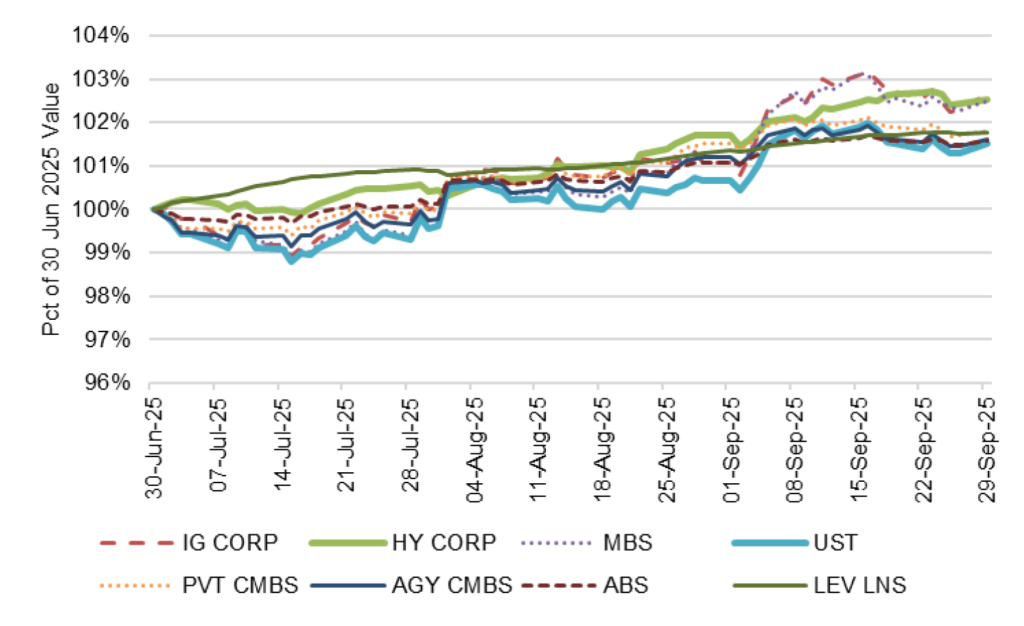
Returns over the last three months may afford one of the best blueprints for US fixed income portfolios over the balance of the year. Falling interest rates especially along the front of the yield curve and tightening spreads in credit and MBS lifted all asset returns from June through September, but especially for risk assets. Credit delivered its usual strong performance, but MBS also put up good numbers. Likely market conditions still point toward keeping interest rate risk positioned on the front of the curve and spread risk in quality assets.
Investment grade credit beats high yield on total return, MBS comes close
High yield has routinely posted top quarterly returns over the last five years, but from June through September the investment grade corporate market did better. MBS came close but still trailed high yield. Investment grade debt in the third quarter returned an annualized 10.59% with high yield at 10.04%. Agency MBS finished just behind at 9.98%. Private CMBS came next at an annualized 7.23% and leveraged loans at 7.03%. Agency CMBS finished at 6.38%, ABS at 6.34% and Treasury debt at 6.15% (Exhibit 1).
Exhibit 1: Investment grade, high yield, agency MBS topped third quarter returns
Source: Bloomberg, Santander US Capital Markets
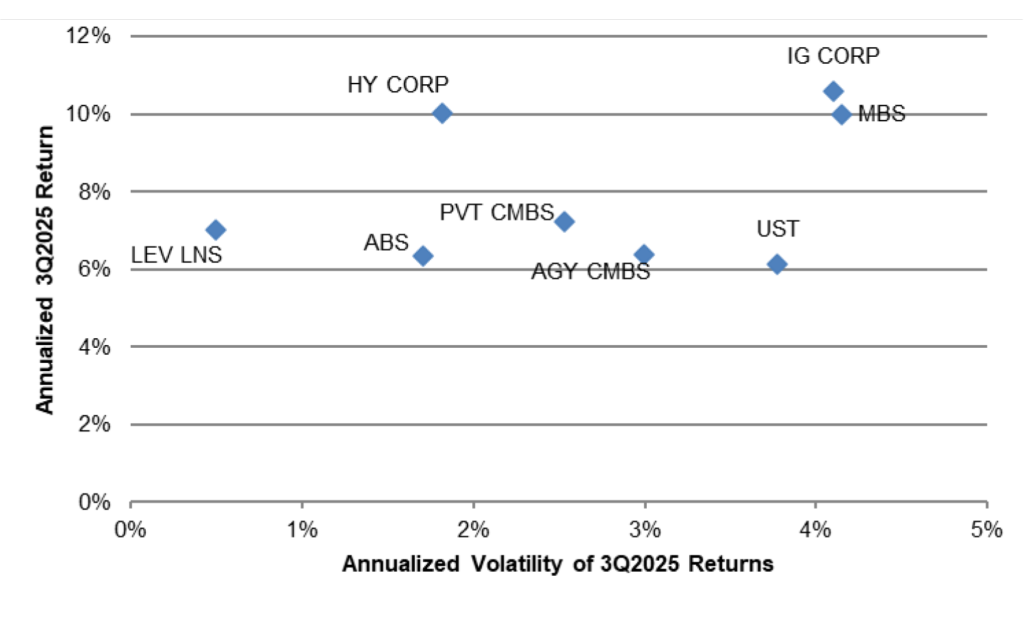
But returns in investment grade and MBS come with higher volatility
The strong returns in investment grade corporates and MBS nevertheless came with twice the volatility of high yield. Investment grade and MBS returns showed an annualized standard deviation of 4% from June through September with high yield at only 2% (Exhibit 2). That meant investment grade returned an annualized 2.58% for each unit of volatility and MBS 2.41% while high yield returned 5.52%. A slightly leveraged position in high yield would have produced top returns with less volatility than other sectors. Leveraged loans technically delivered the top risk-adjusted returns by combining relatively low returns with very low volatility, posting 14.12% for every unit of risk. The constellation of corporate credit and MBS dominated other sectors—ABS, private and agency CMBS and Treasury debt.
Exhibit 2: Investment grade, MBS showed more return volatility than high yield
Source: Bloomberg, Santander US Capital Markets
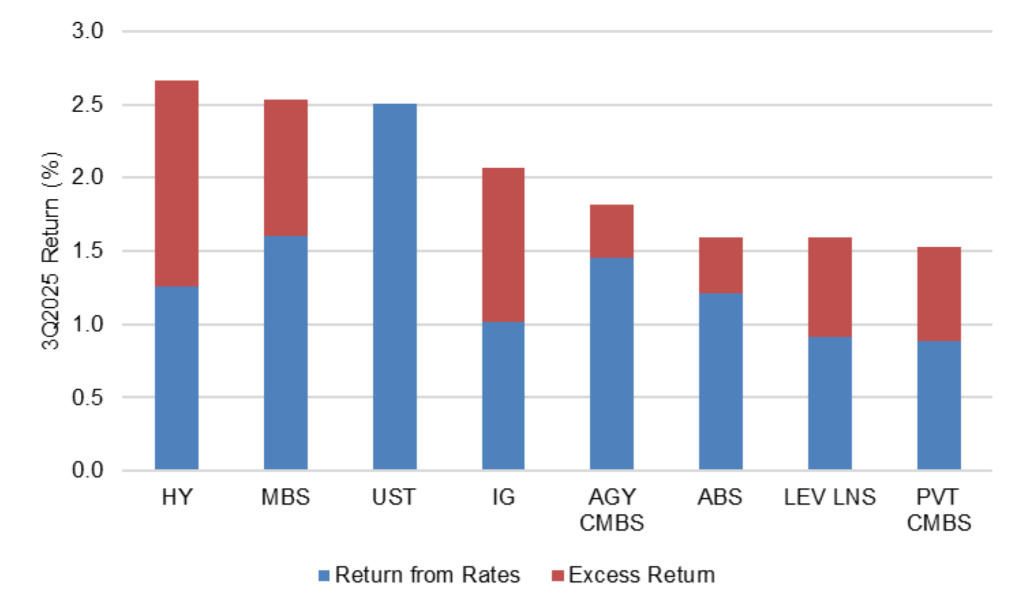
Carry adds significantly in credit and MBS
Falling interest rates, tightening spreads and carry played out in different ways across assets. Roughly half of returns to high yield came from tightening spreads and carry and a third of returns to MBS came from the same, the rest in each category coming from coupon, duration and falling rates (Exhibit 3). In Treasury debt, of course, it all came from rates. Spreads and carry contributed between 40% and 50% of returns in investment grade, leveraged loans and private CMBS. Excess returns added around 20% of the total in agency CMBS and ABS.
Exhibit 3: Excess return added 50% of the total in corporate credit, 37% in MBS
Source: Bloomberg, Santander US Capital Markets
Correlations show deep credit diversifies
Correlations of daily returns from June through September repeated the usual pattern of high correlation between sectors with significant interest rate risk—Treasury debt, MBS, private and agency CMBS and, to a lesser extent, ABS. Pairwise correlation between these assets typically run from 0.80 into the 0.90s (Exhibit 4). With high yield, however, correlations with other sectors dominated by interest rate risk dropped to between 0.40 and 0.50. And with leveraged loans, which are almost all floating-rate, correlations from June through September were negative. These broad patterns have shown up most quarters since 2020, underscoring the ability of deep credit to diversify returns.
Exhibit 4: High correlations between most sectors except high yield, loans
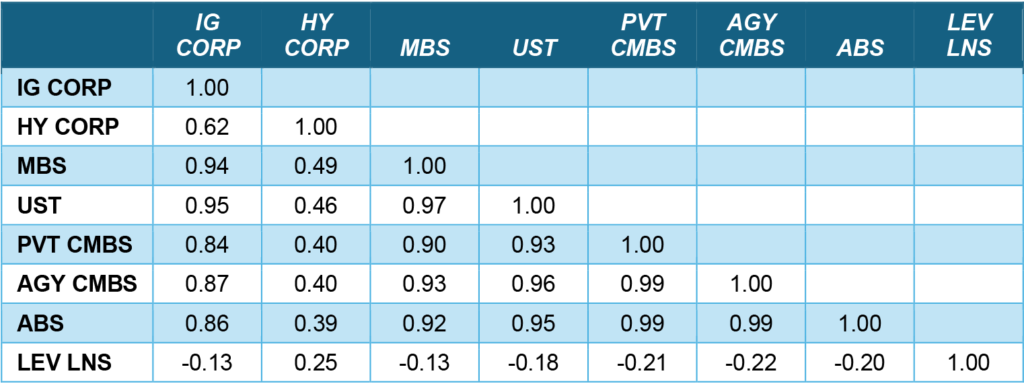
Note: Data shows correlation of daily returns from 6/30/25 to 9/30/25.
Source: Bloomberg, Santander US Capital Markets
Key market conditions persist
Returns from June through September responded clearly to weak payrolls in early August and again in September, which both increased market expectations for Fed cuts. Those expectations played out in markets through a steepening yield curve, at least through August, and steadily tighter spreads from June through September. Spreads also have reflected solid fundamentals on bigger corporate balance sheets and in higher income households as well as improving demand for carry as expected volatility has fallen, steady inflows to ETFs and mutual funds, and a steady supply of Treasury debt that has outstripped the supply of risk assets and compressed spreads.
These conditions persist, arguing for keeping duration along the front of the yield curve and adding investment grade risk in corporate and structured credit. Adding risk in MBS should play to falling volatility. And although fundamental credit in high yield and leveraged loans is clearly weaker than investment grade peers, the ability of these assets to diversify a portfolio argues for at least a small single-digit share of portfolio.
* * *
The view in rates
The market is still roughly aligned with the Fed on the path of policy. Fed funds futures for the end of 2025 now match the Fed median dot from the September FOMC and fall 43 bp below the median dot for the end of 2026. Last week the futures pricing fell 30 bp below the 2026 dot, so the market has become a bit more bullish. My colleague Stephen Stanley is much less bullish. As he points out this week, inflation is still running above the Fed target, making it hard for the Fed to cut very much.
My own relative bearishness about rates in the long end continues. Steady political pressure on the Fed and the background risk of rising US federal deficits should bias longer rates higher, all else equal. The 2s10s curve should steepen.
Key market levels:
- Fed RRP balances settled on Friday at $8 billion, down $40 billion from last week
- Setting on 3-month term SOFR traded Friday at 393 bp, down 6 bp in a week
- Further out the curve, the 2-year note traded Friday at 3.56%, down 8 bp in the last week. The 10-year note traded at 4.11%, down 7 bp on the week
- The Treasury yield curve traded Friday with 2s10s at 54 bp, steeper by 1 bp on the week. The 5s30s traded Friday at 101 bp, steeper by 3 bp
- Breakeven 10-year inflation traded Friday at 234 bp, down 4 bp on the week. The 10-year real rate finished the week at 177 bp, down 3 bp on the week
The view in spreads
The case for tight spreads in credit and MBS continues. Start with an easier Fed, add solid fundamentals, lower volatility, continuing inflows to credit buyers and relatively heavy Treasury supply. Those tides continue to flow. The Bloomberg US investment grade corporate bond index OAS traded on Friday at 73 bp, tighter by 2 bp on the week. Nominal par 30-year MBS spreads to the blend of 5- and 10-year Treasury yields traded Friday at 120 bp, tighter by 5 bp on the week. Par 30-year MBS TOAS closed Friday at 24 bp, unchanged on the week.
The view in credit
Credit conditions move slowly, and the weakest consumers and companies of last week remain the weakest of this week. The news from Tricolor Holdings, in the business of selling used cars to subprime borrowers and financing them, continues to play out. The firm filed bankruptcy on September 9, and investors are now trying to tell if the collapse is due to credit, fraud or both. Serious delinquencies in FHA mortgages and in credit cards held by consumers with the lowest credit scores have been accelerating. Consumers in the lowest tier of income look vulnerable, and renewed student payments and cuts to government programs should keep the pressure on. The balance sheets of smaller companies show signs of rising leverage and lower operating margins. Leveraged loans also are showing signs of stress, with the combination of payment defaults and liability management exercises, or LMEs, often pursued instead of bankruptcy, back to 2020 post-Covid peaks. If persistent inflation keeps the Fed at higher rates, fewer leveraged companies will be able to outrun interest rates, and signs of stress should increase. LMEs are very opaque transactions, so a material increase could make important parts of the leveraged loan market hard to evaluate.