


The Big Idea
A healthy picture of markets for US debt securities
Steven Abrahams | September 19, 2025
This material is a Marketing Communication and does not constitute Independent Investment Research.
The US federal debt ceiling left balances in the US Treasury market almost unchanged in the second quarter while corporate and structured credit, agency debt and MBS and other parts of the securities market grew. But the economy grew even faster, creating plenty of room to soak up supply. Foreign portfolios continued to show health demand for Treasury debt and credit even after the volatility triggered by Liberation Day in April. It may have been “Sell America” then, but it appears to be “Buy America” since.
US debt supply
Outstanding US debt securities grew to $63.1 trillion at the end of June this year, based on the Fed’s latest Financial Accounts of the United States, up 0.7% from March (Exhibit 1). Growth typically slows in the second quarter, so the pace should pick up through September. The Bank for International Settlements only provides global debt statistics through late 2023, but at that point US debt was 45% of the total.
Exhibit 1: US debt securities rise through June to $63.1 trillion
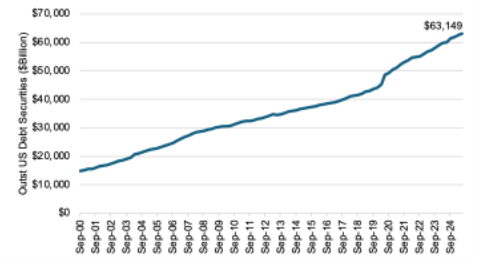
Source: Federal Reserve Financial Accounts of the United States, Santander US Capital Markets
Growth in securities lagged nominal US economic growth, so total debt securities as a share of GDP dropped from 209% to 208%, right at the US average since the end of 2010 (Exhibit 2). The steady share suggests US debt is growing well in line with the ability of the market and the economy to absorb it.
Exhibit 2: Debt securities as a share of GDP is right at the post-GFC average
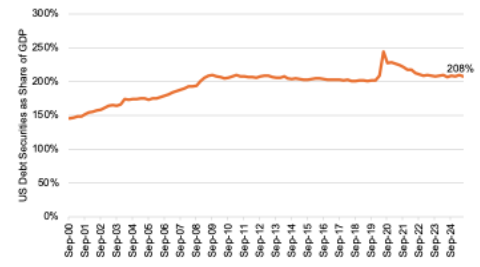
Source: Federal Reserve Financial Accounts of the United States, Bloomberg, Santander US Capital Markets
Marketable Treasury debt continues to dominate, making up 45% of total US debt securities followed by corporate and structured credit at 26% and agency debt and MBS at 20% (Exhibit 3). Municipal securities and commercial paper trail well behind.
Exhibit 3: Treasury debt still dominates US debt securities
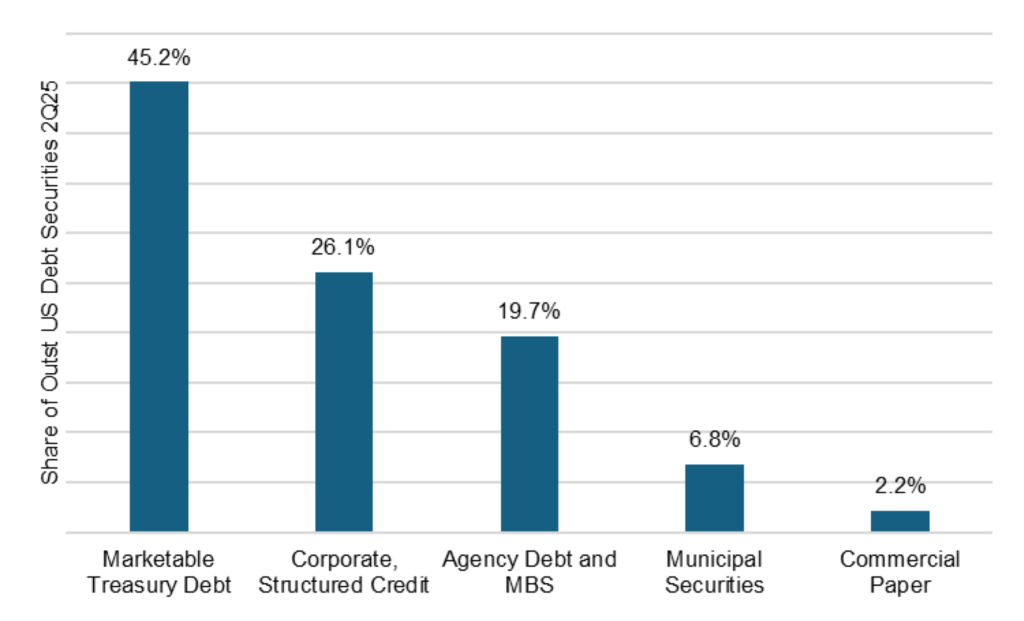
Source: Federal Reserve Financial Accounts of the United States, Santander US Capital Markets
Outstanding balances of marketable Treasury debt have grown much faster than other parts of the market for most of the last five years, but the second quarter offered an exception. Agency debt and MBS and corporate and structured credit grew faster than the Treasury market, which was operating under a debt ceiling and grew only 0.2% (Exhibit 4). With the signing of One Big Beautiful Bill Act in early July and the lifting of the debt ceiling by $5 trillion, the Treasury market should jump back into the lead through September.
Exhibit 4: Growth in Treasury debt through June lagged other sectors

Note: Data shows change in outstanding par amounts.
Source: Federal Reserve Financial Accounts of the United States, Santander US Capital Markets
US debt demand
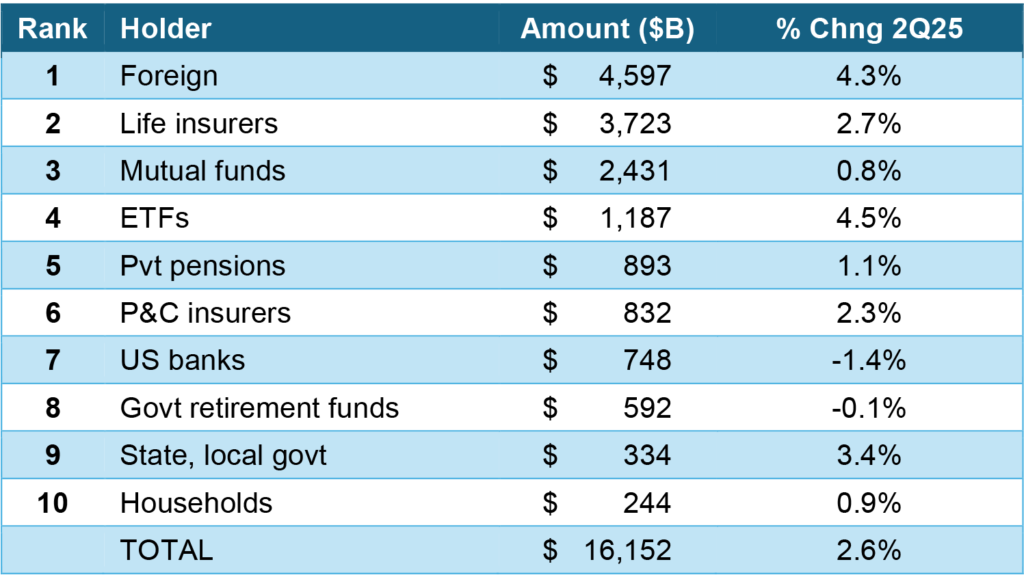
The Treasury market remains dominated by foreign investors and portfolios that use Treasury debt to meet policy or regulatory requirements. Foreign portfolios held the largest share of Treasury market value in the second quarter and grew faster than the outstanding Treasury market (Exhibit 5). This played out despite a pause in foreign buying after Liberation Day in April. Foreign private portfolios have grown Treasury holdings faster than official government portfolios since the GFC. The Fed continued to shrink its Treasury exposure through QT. Households, a category the Fed uses to assign balances not accounted for elsewhere, also grew faster than the market. And money funds, which almost exclusively use Treasury bills, reduced holdings as bill supply dropped under the US debt ceiling in place during the second quarter. US banks grew Treasury exposure at the fastest pace of the 10 largest holders in the market. Mutual funds notably held Treasury balances steady in part after seeing tremendous outflows in April while ETFs far outpaced the market.
Exhibit 5: Treasury demand from the Fed and funds trailed other big holders
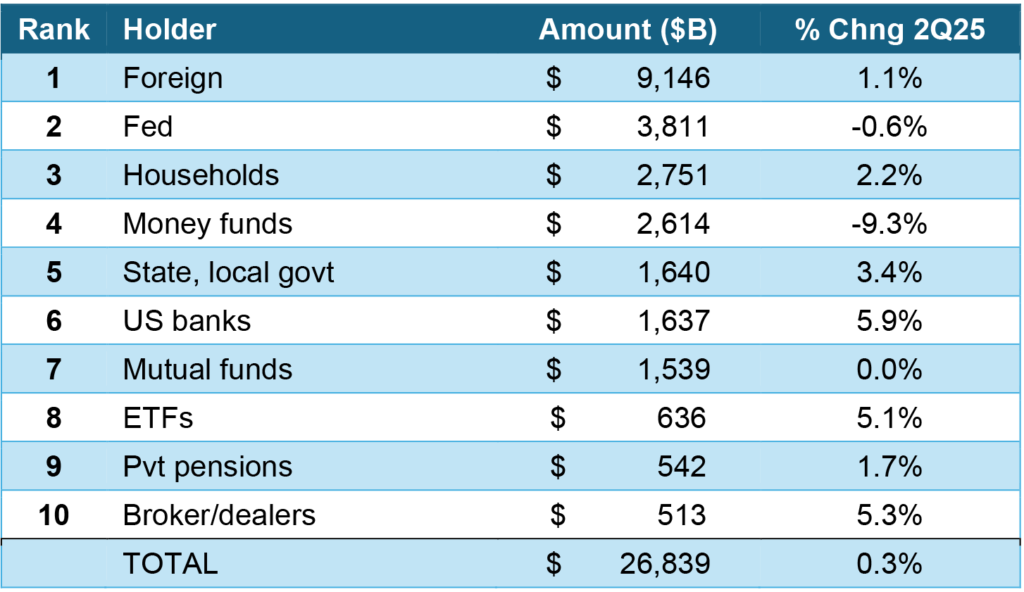
Note: Data shows market value of securities.
Source: Federal Reserve, Santander US Capital Markets
Foreign portfolio continued to play a big role in corporate and structured credit through June along with private portfolios focused on spread and total return. Foreign portfolio, the biggest holder of US corporate and structured credit, grew by 4.3%, more than 1.7 percentage points faster than the overall market (Exhibit 6). Life insurers, the second largest holder, grew in line with the market, and mutual funds lagged. Significant growth in ETFs suggests that asset management vehicle continues to gain ground on traditional mutual funds.
Exhibit 6: Credit demand from mutual funds also trailed other big holders
Note: Data shows market value of securities.
Source: Federal Reserve, Santander US Capital Markets
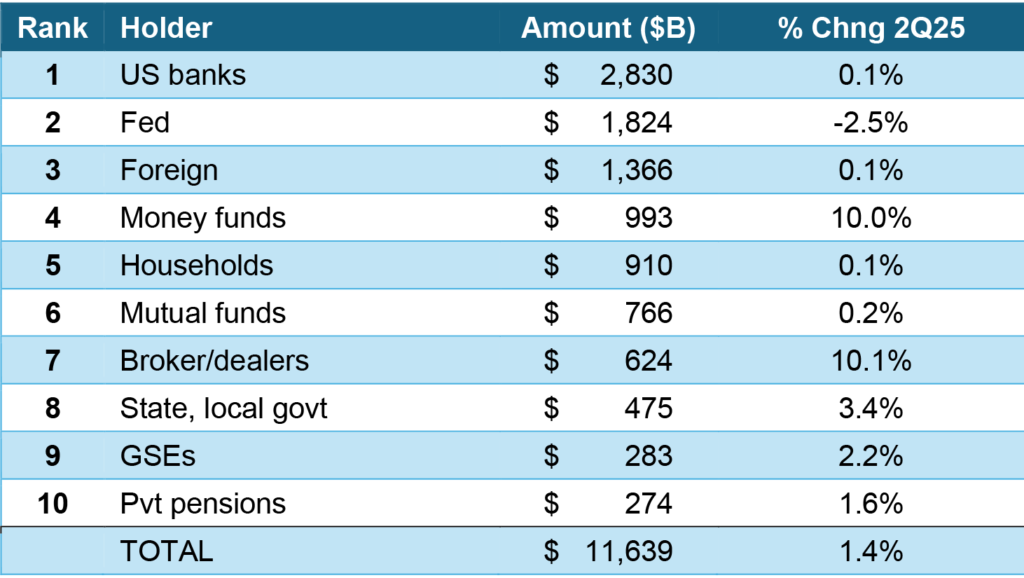
Finally, in agency debt and MBS, demand from the three largest holders lagged overall market growth in the second quarter. Banks, the largest holder in the sector, grew only 0.1% or 1.3 percentage points slower than the market (Exhibit 7). The Fed, the second largest holder, trimmed balances by 2.5% through QT. And foreign portfolios, the third largest holder, also grew by 0.1%. Money funds, likely looking for alternatives to the limited supply of Treasury bills, grew exposure by 10% almost certainly all in agency discount notes and other short debt.
Exhibit 7: The biggest holders of US agency debt and MBS showed light demand
Note: Data shows market value of securities.
Source: Federal Reserve, Santander US Capital Markets
The latest numbers paint a picture of a broadly healthy market in US debt securities. The second quarter did interrupt the trend of growth in Treasury debt steadily outstripping other sectors. But with the reset of the federal debt ceiling, that trend should resume and continue to help tighten spreads in the other risk assets.
* * *
The view in rates
Key market levels:
- Fed RRP balances settled on Friday at $11 billion, back to levels before the Fed began to hike in 2021
- Setting on 3-month term SOFR closed Friday at 400 bp
- Further out the curve, the 2-year note traded Friday at 3.57%, up 1 bp in the last week. The 10-year note traded at 4.13%, up 6 bp on the week
- The Treasury yield curve traded Friday with 2s10s at 56 bp, steeper by 5 bp on the week. The 5s30s traded Friday at 106 bp, steeper by 1 bp
- Breakeven 10-year inflation traded Friday at 239 bp, up 2 bp on the week. The 10-year real rate finished the week at 174 bp, up 4 bp on the week
The view in spreads
he case for tight spreads in credit and MBS rests on an easier Fed, solid fundamentals, lower volatility, continuing inflows to credit buyers and relatively heavy Treasury supply. The Bloomberg US investment grade corporate bond index OAS traded on Friday at 72 bp, tighter by 3 bp on the week. Nominal par 30-year MBS spreads to the blend of 5- and 10-year Treasury yields traded Friday at 111 bp, tighter by 8 bp on the week. Par 30-year MBS TOAS closed Friday at 26 bp, wider by 2 bp on the week.
The view in credit
The weakest consumers and companies are showing stress. The latest news comes from Tricolor Holdings, in the business of selling used cars to subprime borrowers and financing them, which filed bankruptcy on September 9. Serious delinquencies in FHA mortgages and in credit cards held by consumers with the lowest credit scores have been accelerating. Consumers in the lowest tier of income look vulnerable, and renewed student payments and cuts to government programs should keep the pressure on. The balance sheets of smaller companies show signs of rising leverage and lower operating margins. Leveraged loans also are showing signs of stress, with the combination of payment defaults and liability management exercises, or LMEs, often pursued instead of bankruptcy, back to 2020 post-Covid peaks. If persistent inflation keeps the Fed at higher rates, fewer leveraged companies will be able to outrun interest rates, and signs of stress should increase. LMEs are very opaque transactions, so a material increase could make important parts of the leveraged loan market hard to evaluate.