


The Big Idea
Top 5 reasons investors keep buying credit at current spreads
Steven Abrahams | September 12, 2025
This material is a Marketing Communication and does not constitute Independent Investment Research.
Spreads in corporate and structured credit seem tight by most measures, but that has not stopped spreads from going tighter. Ask investors why they keep putting money to work, and you get a handful of reasons. The counterarguments come, too, but just not as often or as convincing as the case for continuing to invest. Hedge a little, perhaps, by doing it in stronger names or stronger structures.
Reason 1: The Fed should cut and help cash flow
Credit investors are banking on the Fed coming to the rescue of a slowing labor market and helping corporate and household cash flow in the process. The market now prices 72 bp of cuts by the end of 2025 and 141 bp by the end of 2026. That would reduce interest expense across the economy and leave more money in the pockets of businesses and households, a clear credit positive.
Most investment grade balance sheets and most households with mortgages have fixed-rate debt, so the impact there should be marginal. But for smaller or more leveraged companies that rely heavily on floating-rate debt, the impact could be significant.
The Fed, of course, may not deliver as much as the market expects. That depends on inflation, where many economists suspect tariffs have not fully shown their hand. And it depends on the Fed’s interpretation of a labor market affected by a significant drop in immigration. The Congressional Budget Office in January projected monthly net immigration of 168,000, but various sources now put that somewhere between -44,000 and 41,000. While the CBO projections would lead to 155,000 new jobs a month to maintain full employment, the lower projections imply a breakeven ranging from 32,000 to 82,000. Slow job growth may not signal as much weakness as it did a year ago. The Fed could deliver fewer cuts than expected.
Reason 2: Corporate fundamentals look solid
Corporate fundamentals do look solid at least through mid-year for larger companies; for smaller companies, not so much. Companies in the S&P 500 are seeing earnings rise, leverage fall, liquidity go up and margins expand. Upgrades continue to outpace downgrades this year by 1.45x in investment grade names, which tend to be larger balance sheets. This argues that spreads on most investment grade balance sheets should be tight. Smaller companies, at least as represented by the Russell 2000, are seeing earnings flat, leverage rise, solid liquidity but declining margins. If high yield is a reasonable proxy for smaller issues, then downgrades are outpacing upgrades this year by 1.41x. The argument that corporate fundamentals look solid should only apply to bigger balance sheets.
Reason 3: Volatility looks likely to keep falling, improving demand for carry
Realized rate volatility has plunged since April to some of the lowest levels since the Fed started hiking in 2022, and future volatility implied in rates options has dropped similarly (Exhibit 1). That makes a good market for yield and carry, increasing the draw of credit, among other risk assets. Demand for carry has already helped flatten credit curves. If the Fed does cut and add liquidity to the financial system, volatility should keep declining. Adding carry is a good idea.
Exhibit 1: Realized, implied rate vol has declined significantly
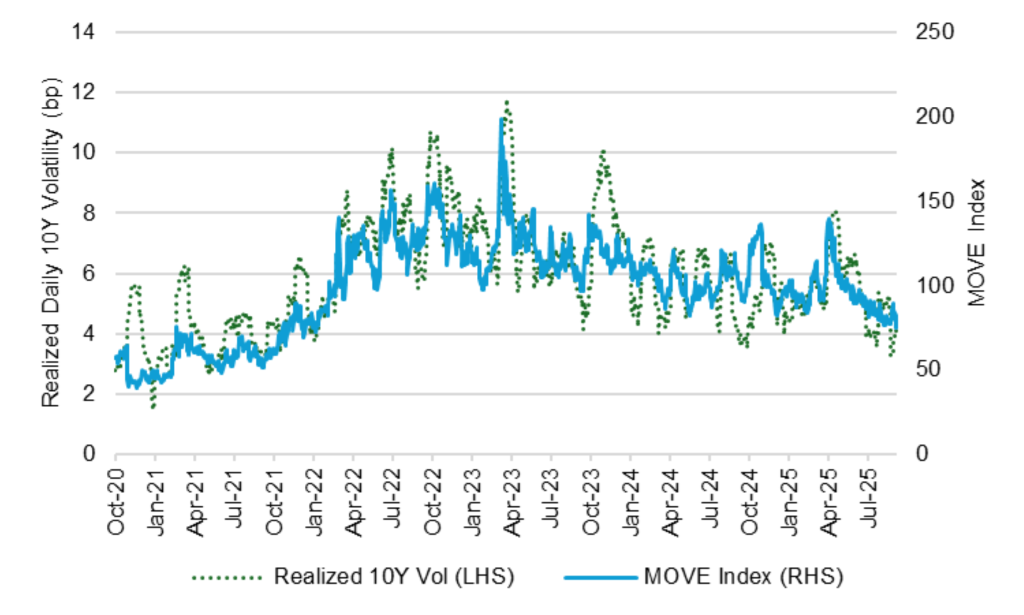
Source: Bloomberg, Santander US Capital Markets
Reason 4: Inflows to mutual funds and insurers should keep demand strong
Investment grade corporate bond mutual funds and ETFs have seen inflows in all but 10 of the last 52 weeks, according to Lipper weekly flows, and issuance of fixed annuities by insurers continues to run at a near-record pace (Exhibit 2). Insurers generally need to invest annuity proceeds in relatively convex assets with spread, which broadly describes corporate credit and some structured credit. Relatively high absolute US rates have made annuities attractive, and as long as that continues, insurer demand for credit should continue as well. Beyond inflows, the record $7.2 trillion of cash in money market mutual funds could serve as a backstop to credit spreads if the curve continues to trend steeper.
Exhibit 2: Rising annuity sales create demand for spread assets
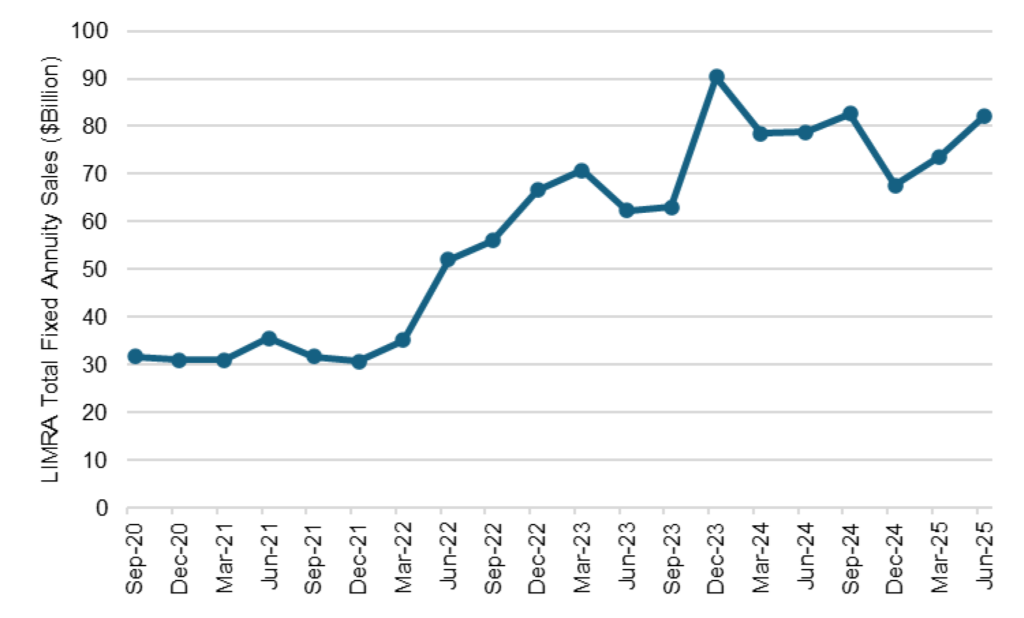
Source: Bloomberg, Santander US Capital Markets
Reason 5: Credit supply should keep lagging Treasury, tightening spreads
Spreads, after all, are nothing more than the difference in the price of credit across markets, reflecting expected differences in fundamentals, supply and demand. On the supply front, the actual and expected balance of government credit has steady outstripped every major risk asset. The par balance of marketable Treasury debt has grown faster than the par balance of investment grade corporate debt, high yield corporate debt and agency MBS over multiple horizons in the last five years (Exhibit 3). With the Congressional Budget Office projecting that Treasury debt as a share of GDP will rise from nearly 100% today to nearly 125% a decade from now, Treasury supply should continue outstripping supply of risk assets. That is a steady force for tighter risk spreads.
Exhibit 3: Growth in outstanding par USTs has steadily outstripped risk assets
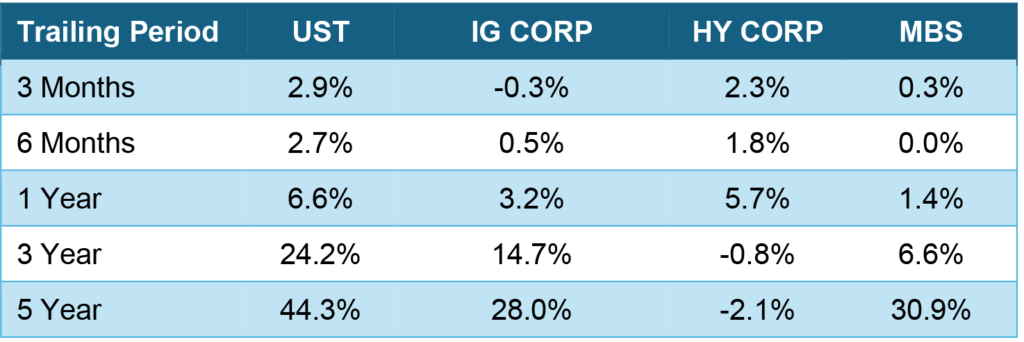
Note: Data show percentage change in par balance over selected periods. Treasury based on outstanding par marketable Treasury debt, corporate, high yield and MBS on outstanding par securities eligible for the Bloomberg market index.
Source: Bloomberg, Santander US Capital Markets
The loyal opposition
The plausible counters to these reasons seem straightforward:
- The Fed cuts less than expected or even hikes to contain inflation
- Slowing growth weakens even some larger balance sheets
- Volatility returns with uncertainty around the Fed path
- Slower growth reduces inflows to credit, or
- The federal government gets fiscal religion and reduces debt supply
None of these counters seem as strong or as likely as the reasons many investors cite for continuing to put money in corporate and structured credit. My preference would be to do it in stronger issuers or better structures, less subject to spread volatility if the reasons turn out over time to be wrong. Call me a sucker for the better balance of risk and return usually offered by stronger credit. But I would still be among those putting money to work at current spreads.
* * *
The view in rates
The political pressure on the Fed continues with the administration on September 11 asking a federal appeals court to let the president remove Governor Lisa Cook. A US district court on September 9 had temporarily blocked her removal. If the appeals court rules for the administration, Cook could miss the September 17 FOMC meeting. Meanwhile, the Senate Banking Committee advanced to the full Senate the administration’s nomination of Stephen Miran for the Board of Governors. If he is approved before September 17, he could vote at the upcoming FOMC. Along with rising projected US deficits, the challenge to Fed independence adds to the pressure for higher yields at longer maturities.
The fed funds market now is priced at 3.62% for the end of the year, 25 bp below the median dot from the June FOMC meeting and unchanged from a week ago. That would require 71 bp of easing from here. Perhaps as important, fed funds futures also price for a 2.91% rate at the end of 2026, implying the Fed will keep easing through next year. As Stephen Stanley points out, a wide range of measures show inflation running above the Fed’s 2% target. At the same time, payrolls again in August point to a weak labor market and a slowing economy. The Fed has tough decisions to make in balancing its mandates for inflation and employment.
Other key market levels:
- Fed RRP balances settled on Friday at $17 billion, nearly back to levels before the Fed began to hike in 2021
- Setting on 3-month term SOFR closed Friday at 404 bp, priced for a Fed cut in September
- Further out the curve, the 2-year note traded Friday at 3.56%, up 4 bp in the last week. The 10-year note traded at 4.07%, down 2 bp on the week
- The Treasury yield curve traded Friday with 2s10s at 51 bp, flatter by 6 bp on the week. The 5s30s traded Friday at 105 bp, flatter by 12 bp
- Breakeven 10-year inflation traded Friday at 237 bp, down 1 bp on the week. The 10-year real rate finished the week at 170 bp, down 1 bp on the week
The view in spreads
As described earlier, the case for tight spreads rests on an easier Fed, solid fundamentals, lower volatility, continuing inflows to credit buyers and relatively heavy Treasury supply. The Bloomberg US investment grade corporate bond index OAS traded on Friday at 75 bp, tighter by 2 bp on the week. Nominal par 30-year MBS spreads to the blend of 5- and 10-year Treasury yields traded Friday at 119 bp, tighter by 11 bp on the week. Par 30-year MBS TOAS closed Friday at 24 bp, unchanged on the week.
The view in credit
The weakest consumers and companies are showing stress. The latest news comes from Tricolor Holdings, in the business of selling used cars to subprime borrowers and financing them, which filed bankruptcy on September 9. Serious delinquencies in FHA mortgages and in credit cards held by consumers with the lowest credit scores have been accelerating. Consumers in the lowest tier of income look vulnerable, and renewed student payments and cuts to government programs should keep the pressure on. The balance sheets of smaller companies show signs of rising leverage and lower operating margins. Leveraged loans also are showing signs of stress, with the combination of payment defaults and liability management exercises, or LMEs, often pursued instead of bankruptcy, back to 2020 post-Covid peaks. If persistent inflation keeps the Fed at higher rates, fewer leveraged companies will be able to outrun interest rates, and signs of stress should increase. LMEs are very opaque transactions, so a material increase could make important parts of the leveraged loan market hard to evaluate.