


The Big Idea
Summer of discontent
Stephen Stanley | September 12, 2025
This material is a Marketing Communication and does not constitute Independent Investment Research.
A softening labor market has become a central focus for financial markets and Fed officials over the past month or two. Deterioration in the recent figures offers a strong sense of déjà vu as it mirrors the 2024 pattern in a number of ways. There are important differences in the economy generally and the labor market specifically from last year to this year, but one key recurrence has been a soft summer performance among the college-age cohort. Last year’s pattern suggests that the numbers for this age group could rebound over the last four months of the year, buoying the aggregate data.
The 2024 pattern
As I laid out in July, a significant portion of the apparent weakness in the summer numbers in 2024 reflected a temporary factor. The job market for new college graduates and college students looking for summer work was unusually soft last year. Take a look at some of the key statistics from the household survey data for the 20-to-24-year-old age cohort (Exhibit 1).
Exhibit 1: Employment metrics for 20-24 age group: summer 2024
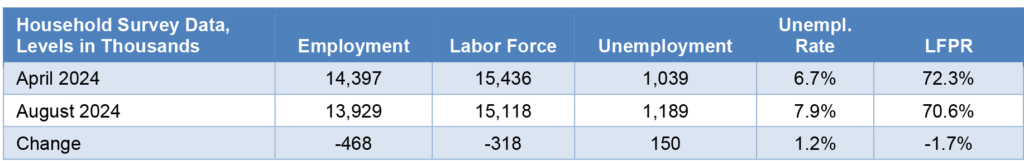
Source: BLS.
I should start with two points.
First, as I have laid out in earlier pieces, the crux of the household survey consists of two questions:
- Are you employed?
- If not, were you actively looking?
So, respondents are broken into three groups. Those who answered “yes” to the first question are employed. Those who answered “no” and then “yes” are unemployed. And those who answered “no” to both questions are out of the labor force. The change in employment will be equal to the change in the labor force minus the change in unemployed.
Second, to help conceptualize the situation, these are seasonally adjusted figures. The seasonal factors are derived based on the history over the past decade. In this context, assume, to make the math easy, that the seasonals look for 1 million young adults to gain jobs during the summer months. Now, figure that, for whatever reason, only 500,000 find work. This will show up as a 500,00 drop in seasonally adjusted employed. This is important in thinking about the 2024 numbers. It was not that 468,000 young adults lost their jobs last summer. Rather, fewer were able to land jobs than had been the case in past summers. As you might expect, the seasonals assume a huge influx of college graduates and college students into the workforce in the summer months, and then the seasonals shift in the fall, when students leave their summer jobs to return to classes and fewer recent graduates launch their careers.
With that as background, let’s dive into the 2024 numbers. They show that the level of seasonally adjusted employment fell by 468,000 over the 4-month period, a massive drop of 3.3%. If we imagine our unlucky college graduate who diligently pursued job opportunities throughout their senior year and came up empty, after walking across the stage and getting their diploma, they have a choice. They can keep actively seeking work or they can give up and play videogames in their parents’ basement or backpack across Europe or volunteer at a charity or whatever. Last year, of the 468,000 young adults who came up dry on a job, roughly two-thirds, 318,000, stopped actively looking over the summer and dropped out of the labor force while the other 150,000 kept up their job searches but remained unemployed. As a result, the unemployment rate jumped by over a full percentage point, from 6.7% to 7.9%, while at the same time, the labor force participation rate sank by nearly two full percentage points from 72.3% to 70.6%.
Given these huge swings, the 20-to-24-year-old cohort had a disproportionate impact on the aggregate labor figures. This age group accounts for only 8% of the working-age population. However, nine basis points of the 34 bp rise in the aggregate unemployment rate, or 27% of the total, came from this cohort. Moreover, the flat overall labor force participation rate (LFPR) over the 4-month period came despite the steep fall in the 20-24 LFPR, which subtracted 14 bp from the total figure (the prime age, or 25-to-54-year-old LFPR jumped by four tenths of a percentage point over the period). So, the broad aggregates were dragged down noticeably by the college-age cohort.
Fall rebound
Now look at the same statistics for the last four months of 2024 (Exhibit 2). On a seasonally adjusted basis, employment and the labor force both expanded sharply. After the 468,000 decline in the summer months, employment rebounded by 348,000 in the final third of the year. Note again that these are seasonally adjusted figures. The labor force almost completely reversed, rising by 316,000 after the 318,000 fall in the middle third of the year. The unemployment rate fell somewhat but remained well above the April 2024 level at 7.5%, while the LFPR recovered 1.3 percentage points of the 1.7 percentage point fall.
Exhibit 2: Employment metrics for 20-24 age group: fall 2024
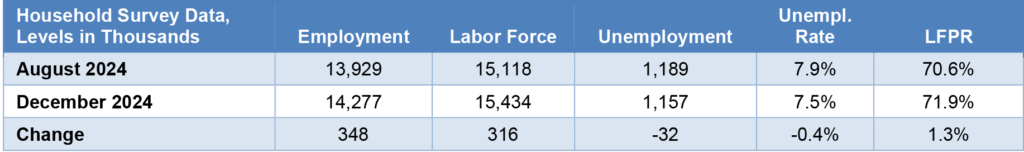
Source: BLS.
As was the case in the summer months, the swings in this cohort had a disproportionate impact on the overall figures. The decline in the 20-24 unemployment rate accounted for three of the 11 bp fall in the aggregate measure (or 27% vs. its 8% weight).
My conclusion is that the labor market was not deteriorating by as much as it appeared to be in the summer, as the technical issue of seasonality in the college-age job market exaggerated the summer weakness. To be sure, there is an element of underlying softness here, as college graduates and students were having trouble finding work. However, the nature of the seasonal patterns concentrated the downward impetus from this factor into a few months of the year, with a partial reversal coming later.
Trending toward a repeat in 2025?
Now on to the same data for the past four months, the summer of 2025 (Exhibit 3). The changes over the 4-month period are remarkably similar to a year ago. Employment fell for this cohort by 523,000, a whopping 3.6%. Parenthetically, to provide some perspective to that number, if the overall employment level fell by 3.6%, it would amount to a drop of six million jobs. Of that decline, 405,000 stopped looking and fell out of the labor force, while the other 117,000 kept looking and added to the tally of unemployed. As a result, as was the case last year, the unemployment rate rose at the same time as the LFPR sank. The former rose by a full percentage point to 9.2%, while the latter plunged by nearly two full percentage points.
Exhibit 3: Employment metrics for 20-24 age group: summer 2025
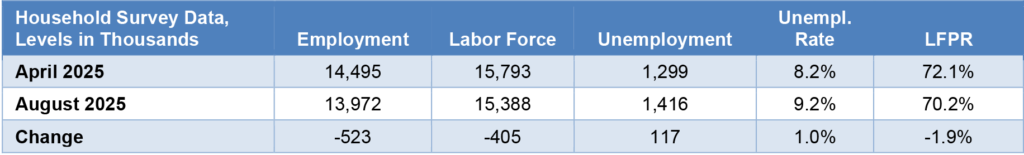
Source: BLS.
Once again, the aggregate numbers worsened over the summer this year. The unemployment rate crept up by 13 bp, from 4.19% in April to 4.32% in August. However, the 20-to-24-year-old cohort accounted for eight of the 13 bp, over half of the backup despite only an 8% weight of the working-age population. At the same time, the aggregate LFPR declined by three tenths of a percentage point, from 62.6% to 62.3%, but half of that fall was accounted for by the college-age group.
Déjà vu?
In 2024, the aggregate unemployment rate backed up by over a third of a percentage point from April to August and payroll gains slowed sharply, averaging only 82,000 per month in June, July and August after averaging 180,000 over the first five months of the year. We can even add in a huge downward benchmark revision (-818,000) that was released in late August.
All of this spooked the Fed a year ago. Chair Powell’s Jackson Hole speech in August last year suggested that he was quite worried about a deteriorating labor market and sparked a rush by the Fed to cut rates, starting with a 50 bp move in September.
Then, the very next labor market report, for September 2024, showed a 254,000 surge in payroll employment and an 11 bp slide in the unemployment rate, immediately shifting the perception of the health of the labor market and making the Fed’s jumbo move in September look like overkill. Over a third of the September bounce in the household survey employment gauge and close to two-thirds of the decline in the unemployment rate were accounted for by the 20-24 age cohort.
There is far too much month-to-month volatility in the household survey results to assume that the pattern this September will precisely mimic last year’s. In addition, there are other big trends impacting the data, including the reticence of firms to hire in light of policy-related uncertainty and the dramatic tightening in immigration policy. Nevertheless, I believe that the risks favor a firmer set of numbers in September and over the next few months, particularly on the household survey side, than in recent months due to this college age pattern.
The Fed is poised to cut rates this month on the back of downside labor market risks, even while inflation remains far above the 2% target, and financial market participants are pricing in a series of easing moves beyond that. However, if last year’s pattern repeats itself this fall, a few months from now, we may look back and chuckle, for the second year in a row, at the late-summer labor market freakout.