


The Big Idea
Cash into barbells into risk assets
Steven Abrahams | September 5, 2025
This material is a Marketing Communication and does not constitute Independent Investment Research.
Sitting in cash might seem like an odd thing to do ahead of likely Fed cuts, but a record $7.2 trillion of it now sits in money market mutual funds. A healthy share of that likely represents the front end of duration barbells, or at least it should. Because of the shape of the curve, a barbell anchored by cash not only adds convexity but yield and carry as well. And a barbell that sets duration along the front of the yield curve should do well as the Fed cuts. Perhaps more importantly, the cash anchoring those barbells looks likely to act as a backstop to spreads in risk assets in the months ahead.
Money fund balances have steadily set records as the Fed has made the very short end of the curve the highest yielding point since the beginning of 2023, at least among 7-year or shorter maturities. Funds added another $130 billion in August, growing by 1.8% (Exhibit 1). The add came despite increasing conviction in the fed funds futures and SOFR swaps markets about rate cuts. It was the biggest monthly absolute and percentage AUM gain of the year.
Exhibit 1: Money fund AUM finishes August at a record $7.2 trillion
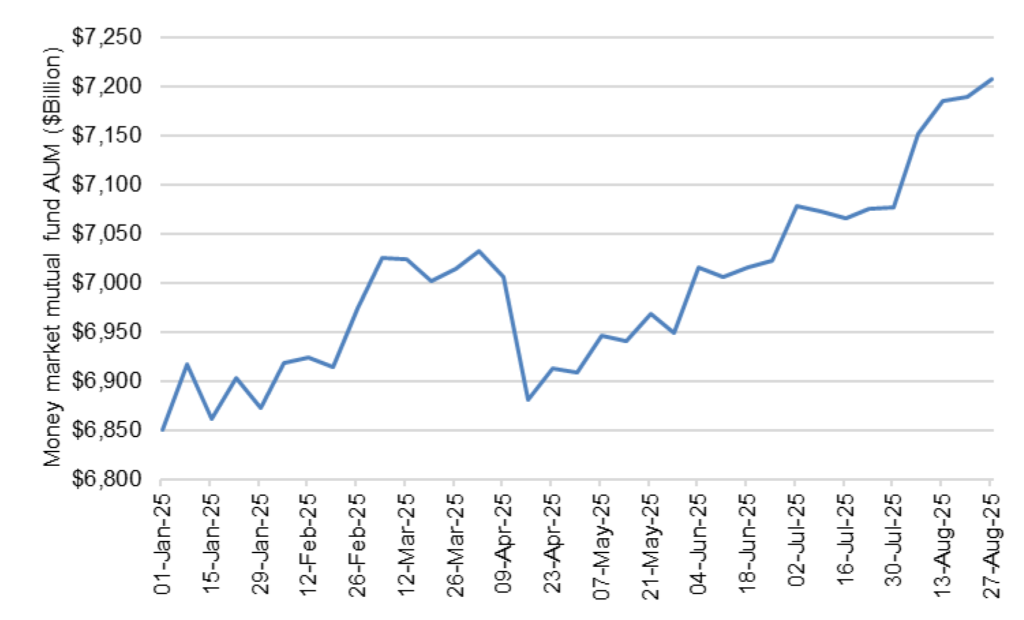
Source: Bloomberg, Santander US Capital Markets
High yield consequently makes cash an interesting starting point for a barbell these days. The convexity that any barbell adds compared to a bullet of the same duration usually costs an investor through lower yield. But not today. For example, barbells of cash and 5-year Treasury notes add 35 bp of yield and convexity beyond the alternative of holding 3-year bullets (Exhibit 2). The same goes for cash and 3-year notes with 19 bp more yield compared to 2-year bullets, or cash and 2-year notes with 14 bp more yield compared to 1-year bills. Cash currently gives a barbell a relatively rare yield advantage.
Exhibit 2: Barbells with high-yielding cash add convexity and carry
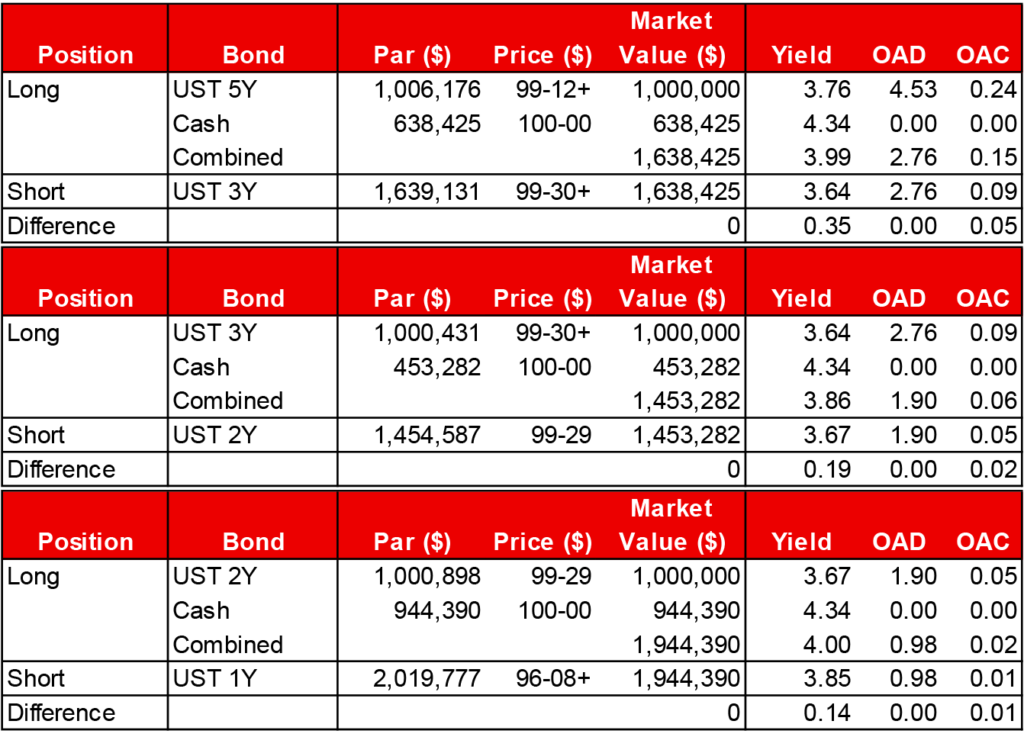
Note: duration- and proceeds-neutral barbells of cash and Treasury notes against Treasury bullets. Over time, the duration of a bullet will shorten faster than the duration of a barbell, requiring rebalancing to remain duration-neutral.
Source: Yield Book, Santander US Capital Markets
Cash also makes sense as a first step for a market that seems most comfortable these days taking duration on the front end of the yield curve. Fed Chair Powell sent clear signals at Jackson Hole of at least his inclination to ease in September, a clear plus for the front end. But longer maturities have to weigh the risk of increasing political pressure on the Fed, which could make the Fed over time more likely to let the economy run hot and push up inflation and risk premiums. Longer maturities also have to consider rising US fiscal deficits. Shorter maturities should outperform longer while political and fiscal pressures persist. Combining cash with 5-year or shorter duration gets there.
Current tight spreads in risk assets point to significant appetite for income, raising the possibility of swapping Treasury notes on the long end of a barbell for assets with similar duration but more yield and carry. For example, the average corporate ‘AA’ issue trades at a spread of 42 bp over the Treasury curve, the average ‘A’ at 61 bp and the average ‘BBB’ at 90 bp. Fannie Mae DUS, an agency credit, trades at 45 bp. And 30-year Fannie Mae TBA pass-throughs at a nominal spread of 158 bp. All of these, except arguably for the pass-through, involve giving up significant liquidity, although that could be offset by the cash side of the barbell. A barbell with cash and credit or cash and MBS would add significant income, although there’s a good case to do that with stronger credits or relatively more convex MBS.
Exhibit 3: Candidates for the long end of a barbell (nominal spread to Treasury)
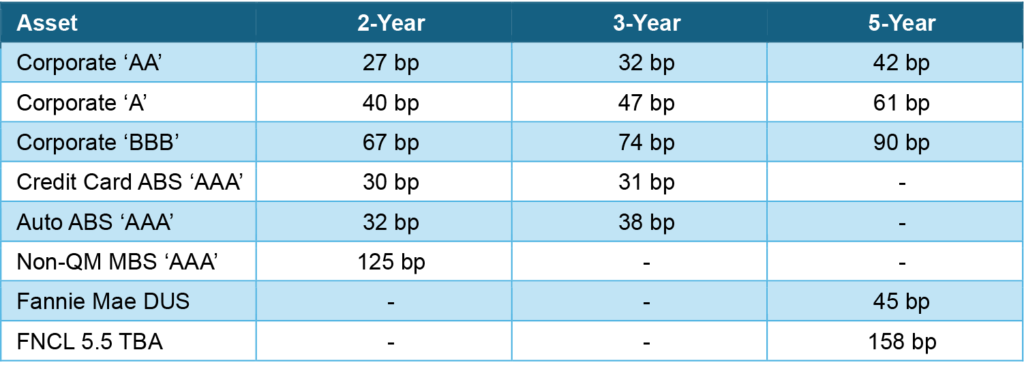
Source: Bloomberg, Santander US Capital Markets as of 9/4/2025
Of course, there are ways the long end of the yield curve could defy current implied forward pricing and rally. Treasury Secretary Bessent clearly would like to get longer yields down. The Treasury could do that by reducing issuance at longer maturities or buying back current issues. Some investors will remember that when Treasury announced on October 30, 2001, that it would end regular sale of 30-year bonds, yields on the bond dropped 33 bp on that day alone. Of course, the tradeoff would likely be lower liquidity in those longer issues.
The other potential impact of current record cash balances is as a backstop to risk spreads over time. If the Fed ends up cutting steadily, the steepening of the curve will reduce or even end the yield advantage of cash, increasing the appeal of other assets. A material weakening in the economy might widen spreads in credit, for example, but a mountain of cash is sitting on the sidelines comparing cash yields to credit. Small reallocation of $7.2 trillion could go a long way to keep spreads from widening too much in corporate and structured credit or in agency MBS. That should limit spread risk across these assets for a long time.
* * *
The view in rates
The hottest topic in the rates market has been the steady political pressure on the Fed, which could make the Fed more likely over time to let the economy run hot. A strong economy usually sells well on Election Day, after all, although it can also push up inflation and risk premiums along the yield curve. The spotlight for now is on administration efforts to fire Fed Governor Lisa Cook, which could end up setting the bar for presidential control over a governor’s term anywhere from high to low—in the latter case, blowing wide open the notion of Fed independence. But even if the bar stays high, the market has to consider the possibility that a steady pressure campaign could wear the institution down. Beyond Cook, the administration currently is jawboning the Fed to ease, asserting that the Fed has mismanaged its construction budget, asking chair Jerome Powell to resign, and backing the current chair of the president’s Council of Economic Advisors, Stephen Miran, to fill a temporary opening on the FOMC on an accelerated schedule. The administration could nominate a shadow chair in February. And with the current 5-year term of all reserve bank presidents expiring on March 1, political pressure could come to bear there, too. Of course, it is too early to know if the administration will keep pushing. But the possibility has to figure in the rates calculus. Along with rising projected US deficits, this adds to the pressure for higher yields at longer maturities.
The fed funds market now is priced at 3.62% for the end of the year, 25 bp below the median dot from the June FOMC meeting. That would require 71 bp of easing from here. Perhaps as important, fed funds futures also price for a 2.86% rate at the end of 2026, implying the Fed will keep easing through next year. As Stephen Stanley points out, a wide range of measures show inflation running above the Fed’s 2% target. At the same time, payrolls again in August point to a weak labor market and a slowing economy. The Fed has tough decisions to make in balancing its mandates for inflation and employment.
Other key market levels:
- Fed RRP balances settled on Friday at $21 billion, nearly back to levels before the Fed began to hike in 2021
- Setting on 3-month term SOFR closed Friday at 413 bp, priced for a Fed cut in September
- Further out the curve, the 2-year note traded Friday at 3.52%, dropping 7 bp on the day’s weak August payrolls. The 10-year note traded at 4.09%, also down 7 bp on the day.
- The Treasury yield curve traded Friday with 2s10s at 57 bp. The 5s30s traded Friday at 117 bp.
- Breakeven 10-year inflation traded Friday at 238 bp. The 10-year real rate finished the week at 171 bp.
The view in spreads
Spreads look relatively tight against the Treasury curve. That seems to heavily discount the risk of slower growth. Net supply is also light, or in the case of investment grade corporate debt, negative. The Bloomberg US investment grade corporate bond index OAS traded on Friday at 77 bp. Nominal par 30-year MBS spreads to the blend of 5- and 10-year Treasury yields traded Friday at 130 bp. Par 30-year MBS TOAS closed Friday at 24 bp.
The view in credit
The weakest consumers and companies are showing stress. Serious delinquencies in FHA mortgages and in credit cards held by consumers with the lowest credit scores have been accelerating. Consumers in the lowest tier of income look vulnerable, and renewed student payments and cuts to government programs should keep the pressure on. The balance sheets of smaller companies show signs of rising leverage and lower operating margins. Leveraged loans also are showing signs of stress, with the combination of payment defaults and liability management exercises, or LMEs, often pursued instead of bankruptcy, back to 2020 post-Covid peaks. If persistent inflation keeps the Fed at higher rates, fewer leveraged companies will be able to outrun interest rates, and signs of stress should increase. LMEs are very opaque transactions, so a material increase could make important parts of the leveraged loan market hard to evaluate.