


The Big Idea
Gauging (persistent) underlying inflation
Stephen Stanley | August 15, 2025
This material is a Marketing Communication and does not constitute Independent Investment Research.
There is a long history of dovish Fed officials twisting themselves into knots parsing the price data in various ways to argue that underlying inflation is really not as bad as it appears. In 2021, there was the infamous “transitory” episode. In 2023 and 2024, several Fed officials popularized the so-called “supercore” gauge that excludes shelter costs, when rent and owners’ equivalent rent were a major contributor to core inflation. More recently, several policymakers have argued that inflation is approaching 2% after excluding the effects of tariffs. An examination of a variety of underlying inflation measures clearly indicates that it would be premature to declare victory.
The case for rate cuts
The two Fed Governors that dissented for an immediate ease in July have both made a case for a benign underlying inflation picture. Governor Bowman delivered a speech on August 9 in which she offered her interpretation of the recent price numbers:
“Turning to price stability, the 12-month measure of core personal consumption expenditures (PCE) inflation stood at 2.8 percent in June, a bit lower than at the end of last year. However, after removing estimates of one-off tariff effects on goods prices, core PCE inflation would have been lower than 2.5 percent in June, which is significant progress and much closer to our 2 percent target. This progress reflects a considerable slowing in core services inflation, which is consistent with recent softness in consumer spending and the labor market no longer being a source of inflation pressures.
The underlying trend in core PCE inflation appears to be moving much closer to our 2 percent target than is currently shown in the data. With housing services inflation on a sustained downward trajectory and other core services inflation already consistent with 2 percent inflation, only core goods inflation remains elevated—likely reflecting limited passthrough from tariffs.”
Back in July, Governor Waller similarly made his argument for an immediate rate cut. His assessment of the inflation situation was that tariff impacts are likely to be temporary and thus should be looked through. Meanwhile, he argued that “Federal Reserve Board staff has done work to try to estimate tariff effects on PCE prices. Using that methodology, if I subtract estimated tariff effects from the reported inflation data, I find the inflation numbers for the past few months would have been quite close to our 2 percent goal.”
Both Bowman and Waller appear to be relying on a Fed Board staff paper published in May that sought to quantify tariff impacts on consumer prices and then calculate an “ex-tariffs” inflation rate, which both Governors now claim is close to 2%.
This feels like a classic case of Fed policymakers relying too much on academic research to draw policy conclusions. The research paper in question is a highly stylized model that attempts to quantify the impact of tariffs imposed on China on consumer prices for specific products based on the amount of imports of those products and a long set of stylized assumptions about how those tariffs would be passed through. This model begs the crucial question: how much of the tariffs will be passed through to consumers and when? The paper constructs a model given a set of assumptions and shows that the model worked pretty well in estimating the 2018-2019 tariffs.
If I were a policymaker, I do not think I would be willing to bet the farm that I knew with any precision the current tariff impact on consumer prices, so that I could construct an “ex-tariffs” price index on which I could set policy. That strikes me as reminiscent of what Powell and many others on the FOMC did in 2022, looking at the core inflation numbers excluding shelter costs and assuming that rent and owners’ equivalent rent were about to cool sharply.
Instead, I prefer the approach of Kansas City Fed President Schmid, who noted on Tuesday:
“I am not confident that we will ever be able to identify the exact (or even general) contribution of tariffs to inflation given the complexity of the problem. The pricing of each tariffed product is determined by the action and interaction of many different actors, from the foreign producer to the domestic importer, to the domestic supply chain and the retailers that ultimately deliver that product to the consumer. Which of these actors bears the cost of the tariff will be determined by an intricate chain of negotiations that importantly will be affected by the availability and costs of substitutes along the entire path to the final consumer. This chain of interactions will vary for each product. Hence, it is almost impossible to anticipate exactly what the effect of tariffs will be on final consumption prices. Considering the additional complication that these decisions are likely to be dynamic and change over time, it becomes apparent that it is not only hard to know how prices will change but also when prices might change.
While economic forecasting is notoriously difficult, I will confidently forecast that a decade from now economists will still be arguing over exactly what impact the tariffs had on inflation. As such, I see no possibility that we will know the effect of the tariffs on prices, either as a one-off shock to the price level or a persistent inflation impetus, over the next few months. Also, I promise that you will not hear me talking about inflation excluding tariffs, which I think is neither a meaningful nor a measurable concept.”
Empirical approach
One way to get around the modeling difficulties discussed above is to rely on a strictly empirical approach. In a paper I published earlier in August, I highlighted a group of 21 line items in the consumer price indices that should be most impacted by tariffs. This subset of goods constitutes almost 12% of the CPI and about 13.5% of the PCE deflator. It is not a comprehensive list of all imported goods, much less a complete accounting of the full impact of tariffs, considering secondary effects, input costs and so on. Nonetheless, it is a starting point for trying to think about how tariffs may be impacting inflation that does not rely on models and stylized assumptions.
In June, the numbers offered a picture that offered support for the Waller and Bowman framework. A number of the 21 line items that I featured posted outsized increases in June. The group accounted for 9 bp of the 0.26% increase in the core PCE deflator. If we assume that group would have posted on balance flat prices in the absence of tariffs, a plausible guess given recent history, the “ex-tariffs” core PCE deflator for June would probably have posted a “low” 0.2% rise. Thus, tariffs likely made the difference between a monthly reading that was over 3% on an annualized basis and one that would have been right around 2% annualized.
However, the July CPI results looked dramatically different. The group of 21 goods subject to tariffs that added so much to inflation in June were essentially flat on balance in July, adding less than 1 bp to the core CPI. That means that an “ex-tariff” core CPI reading for July was a firm 0.3%, and, based on my forecast, the “ex-tariff” core PCE deflator should rise by around 0.3% in July, a 3.7% annualized pace.
Note that the analysis from Bowman and Waller both came before the July CPI report and was likely predicated on and justified by the June inflation numbers. To Bowman’s point, while the level of core services inflation as measured by the PCE deflator remains too high, the trend had been moving in the right direction. The June year-over-year advance was 3.4%, but the six-month annualized and three-month annualized increases were 3.2% and 2.7%, respectively.
The July CPI composition told a very different story, as core services prices, which Bowman concluded were on a path of “considerable slowing,” rebounded sharply, rising by 0.36%, or an annualized pace of nearly 4.5%. Suddenly, the picture looks a bit different. Chicago Fed President Goolsbee specifically noted on Wednesday that the pickup in core services prices in July worried him. I suspect that other Fed officials may take note of this development in the coming days.
Getting to underlying inflation
I have written over the past five years a number of times about various measures of underlying inflation. One that should be quite familiar to my readers is the Ex-Fearsome Five core CPI gauge. I have dubbed the five most volatile and erratic components of the core CPI as The Fearsome Five. They are apparel, airfares, hotel rates, and new and used vehicle prices.
This aggregate highlights a blind spot for much of the analysis from Fed officials on inflation. Policymakers have made a habit of excluding important components of core inflation like shelter costs to fine-tune their narrative, but they seem to seldomly consider the impact of fleeting swings in some of the most erratic line items within the core. For example, much of the reason that core services inflation seemed to be on a declining trend through June is that airfares fell for five straight months through June by a cumulative 15% and hotel rates dropped over the same period by a cumulative 8%. This is obviously not a sustainable pillar on which to build a path to 2% inflation, but Bowman’s analysis most recently and much of the narrative of Fed officials, including Chair Powell, on inflation since the pandemic has systematically ignored the wild swings in the Fearsome Five, especially for airfares, hotel rates, and at times used vehicle prices.
The year-over-year advance in the core CPI excluding the Fearsome Five is telling (Exhibit 1). The steady progress from a peak of around 5% a few years ago to roughly 3% by the end of last year is clear. However, so far in 2025, this gauge has stalled out, stuck between 2.8% and 2.9% since March. The performance of this aggregate so far in 2025 does not show any further downward momentum, as the 6- and 3-month annualized increases through July were 2.9% and 3.1%, respectively.
Exhibit 1: Year-over-year rise in the core CPI Ex-Fearsome Five
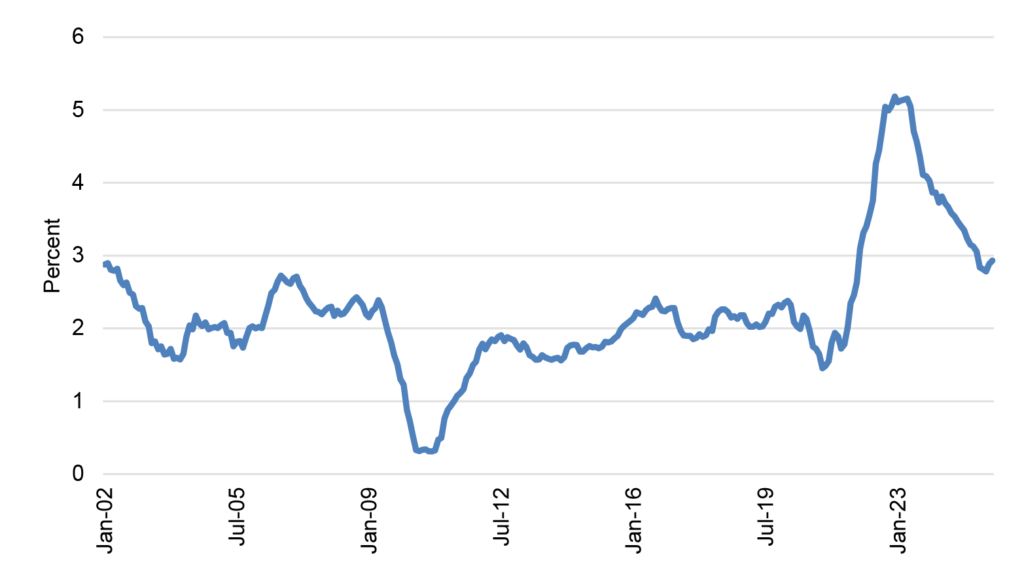
Source: BLS, SanCap calculations.
Even after allowing for a wedge between the core CPI and core PCE deflator, this measure suggests that underlying inflation is stuck somewhere in the 2.5% to 2.75% range rather than trending close to 2%.
Other underlying inflation measures
The Atlanta Fed has created an “Underlying Inflation Dashboard” that assembles a number of alternative gauges, many of which I have highlighted over the past several years (Exhibit 2). As you can see, the latest reading for all nine of these measures is above 2.5%. The CPI-based figures reflect the July release, while the PCE-related gauges are calculated from the June numbers.
Exhibit 2: Atlanta Fed underlying inflation dashboard

Source: Atlanta Fed.
Personally, I am partial to the median and trimmed-mean concepts. The idea behind both is to exclude the outliers that might be distorting the aggregates. As a reminder, a trimmed-mean index ranks all of the components from highest price change to lowest, weights the components according to their weight in the aggregate, and then starts excluding line items at the top and the bottom until it reaches the thresholds. As the table notes, the Cleveland Fed Trimmed-Mean CPI lops 16% off of the top and bottom. The Dallas Fed Trimmed-Mean PCE excludes slightly higher percentages on both extremes. The median concept takes that approach to the extreme, continuing to exclude items until it reaches the middle line item on a weighted basis.
The strategy in both cases is to isolate the line items that are moving at an outsized pace either up or down and focus on the steadier components, filtering out the noise. For what it is worth, though it is not included in the Atlanta Fed dashboard, the Cleveland Fed also produces a Median PCE gauge, which in June was sitting at 3.2%, its highest reading of the year.
The Atlanta Fed Sticky-Price CPI takes a different approach, excluding line items for which prices tend to change frequently. The idea is that for goods and services whose prices do not move very often, price setters will be careful about when and how much to raise prices, likely taking into consideration their perception of overall inflation trends.
The FRB San Francisco Cyclical Core PCE Inflation gauge includes the line items that researchers determined were most correlated to cyclical trends in inflation, a concept quite different from the Sticky Price framework as well as the trimmed-mean and median methodologies.
The bottom line is that every one of these underlying alternative inflation gauges is running far above 2%. Moreover, with the exception of the Dallas Fed Trimmed-Mean PCE index, which posted a 2.7% year-over-year advance in June, one tenth below the corresponding core PCE reading, these alternative gauges are running above their traditional core CPI and core PCE deflator counterparts, suggesting the underlying inflation picture may be worse, not better, than the traditional core gauges would indicate.
Conclusion
Before the July CPI release, there was growing sentiment among the most dovish FOMC members that inflation was moderating toward the Fed’s 2% target on an underlying basis. That proposition was debatable prior to the July CPI, but it is far harder to support in light of the latest data. The composition of the July CPI, which included surprisingly little boost to tariff-sensitive goods categories but a clear acceleration in core services prices, suggests that the FOMC remains far from fulfilling the inflation half of its dual mandate. Of course, the committee may still choose to cut rates in September or later this year on the basis of weaker labor market data, but the hurdle for doing so has likely been raised at the margin by the outcome and, more importantly, the composition of the July CPI.