


By the Numbers
Ginnie Mae TBA quality risks spiraling lower
Brian Landy, CFA | August 1, 2025
This document is intended for institutional investors and is not subject to all of the independence and disclosure standards applicable to debt research reports prepared for retail investors. This material does not constitute research.
The rise of custom pooling in Ginnie Mae II MBS is flashing a warning sign for the quality of the program’s TBA market. Custom Ginnie Mae pools now account for over a third of new issuance, a dramatic rise from just 5% a decade ago. The rise is reducing the share of pools eligible for delivery into a TBA contract and lowering the prepayment quality of those eligible pools. And the trend is highly likely to accelerate. It creates opportunity for originators, investors and brokers, but it also raises complicated questions about the price of mortgage credit for borrowers.
A sharp rise in custom pooling
Ginnie Mae II custom pools account for a rapidly growing share of Ginnie Mae II issuance. Over 35% of gross supply so far this year has come in custom pools (Exhibit 1). This compares to roughly 15% from 2018 through 2022 and only about 5% a decade ago. This rising share is especially striking because SIFMA rules do not allow investors to deliver custom pools to satisfy a TBA contract. Originators are creating and investors are buying custom pools despite the loss of TBA liquidity. And the fragmentation of the Ginnie Mae II market is reducing the liquidity and quality of TBA.
Exhibit 1. Custom pool issuance has risen sharply since 2022.
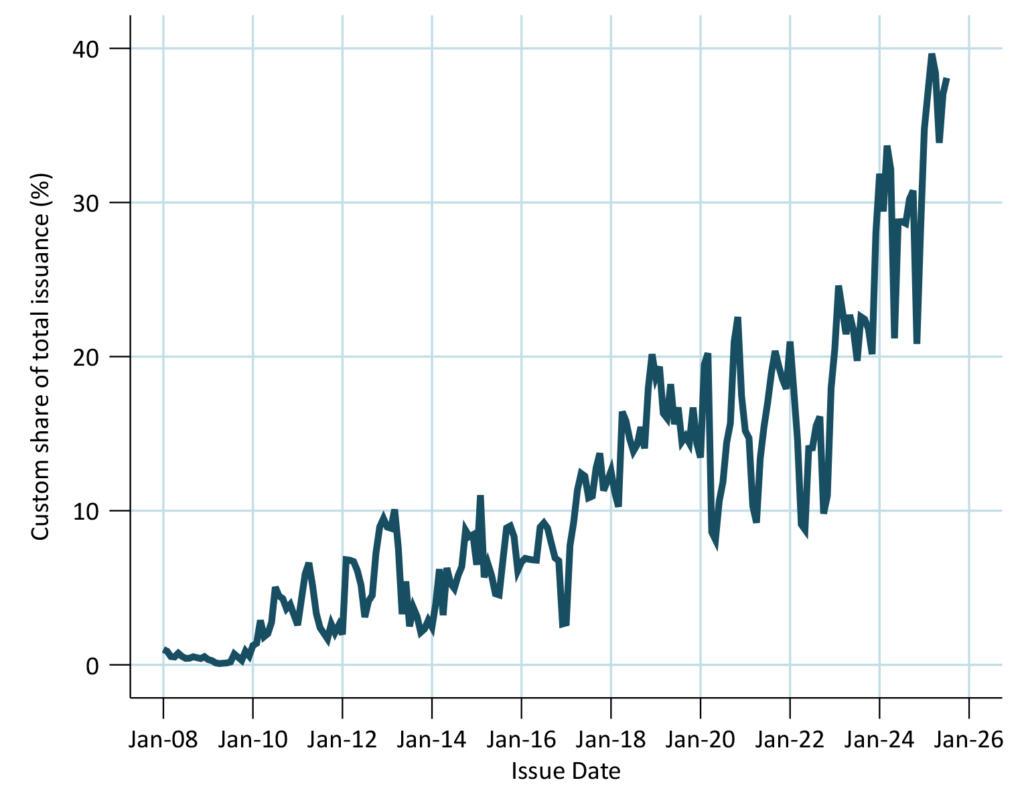
Custom pool issuance as a share of total Ginnie Mae issuance. Fixed-rate 30-year MBS. Includes Ginnie Mae 1 and 2 pools. Ginnie Mae 1 production started slowing in late 2009 and had largely stopped by 2014.
Source: Ginnie Mae, Santander US Capital Markets.
Changing composition of multi pools and TBA
The rise of custom pools reflects originators pulling more FHA and rural housing loans—and even some VA loans with low balances—out of the multiple issuer pools. Investors, led by CMO structuring desks, have recognized the better convexity in these loans compared to larger VA loans (Exhibit 2).
Exhibit 2. FHA and low loan balance VA have better convexity than high balance VA.
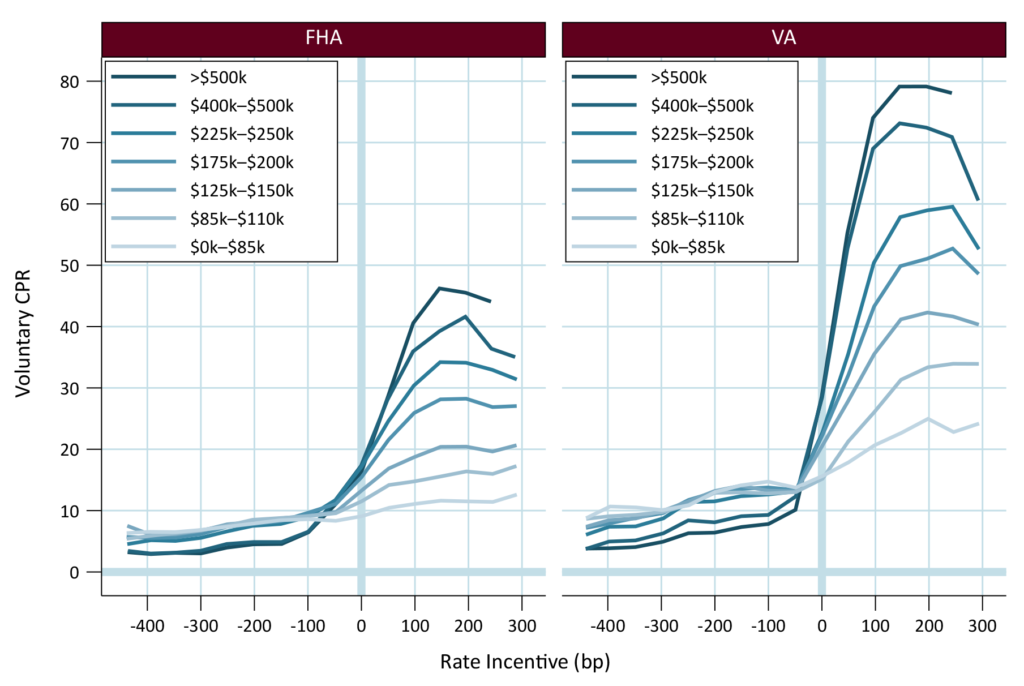
Note: Fixed-rate 30-year loans, loan age between 6 and 24 months, 1-unit properties. FHA rate incentive measured against the prevailing mortgage rate for FHA loans; VA rate incentive uses the prevailing VA rate. Rate estimated using Optimal Blue’s OBMMI indices and historical production levels from January 2020 to the present.
Source: Ginnie Mae, Optimal Blue, Santander US Capital Markets.
FHA loans and even VA loans with small balances offer prepayment protection compared to large VA loans. At 100 bp in-the-money to refinance, for example, the FHA S-curves range from just over 10 CPR for loans with the smallest balance to just over 40 CPR for loans over $500,000. Smaller VA loans also exhibit slower speeds when in-the-money—at 100 bp, the smallest group of VA loans have prepaid around 20 CPR and the largest about 75 CPR. The VA loans still are faster than FHA loans with the same loan size. At 100 bp incentive, VA loans between $175,000 and $200,000 prepay similarly to FHA loans over $500,000. Rural housing loans typically prepay slower than FHA loans when in-the-money for the same rate incentive and loan size.
Multiple issuer pools become more negatively convex as relatively more convex loans leave the pool. The share of VA loans and high balance loans has increased alongside custom pool issuance. This lowers the value of TBA.
The share of VA loans in multi pools has jumped from around 40% at the start of 2024 to nearly 60% in recent months (Exhibit 3). The rising share could be because overall VA originations are surging, or because FHA and other loans are leaving the pool. Comparing the spread between VA share of multi pools to the VA share of total issuance controls for changes in production. That spread widened from about 5% during the pandemic to over 15% in recent months, suggesting some of the growth is due to increased custom pool issuance.
Exhibit 3. The share of VA loans in multi pools has jumped since 2022
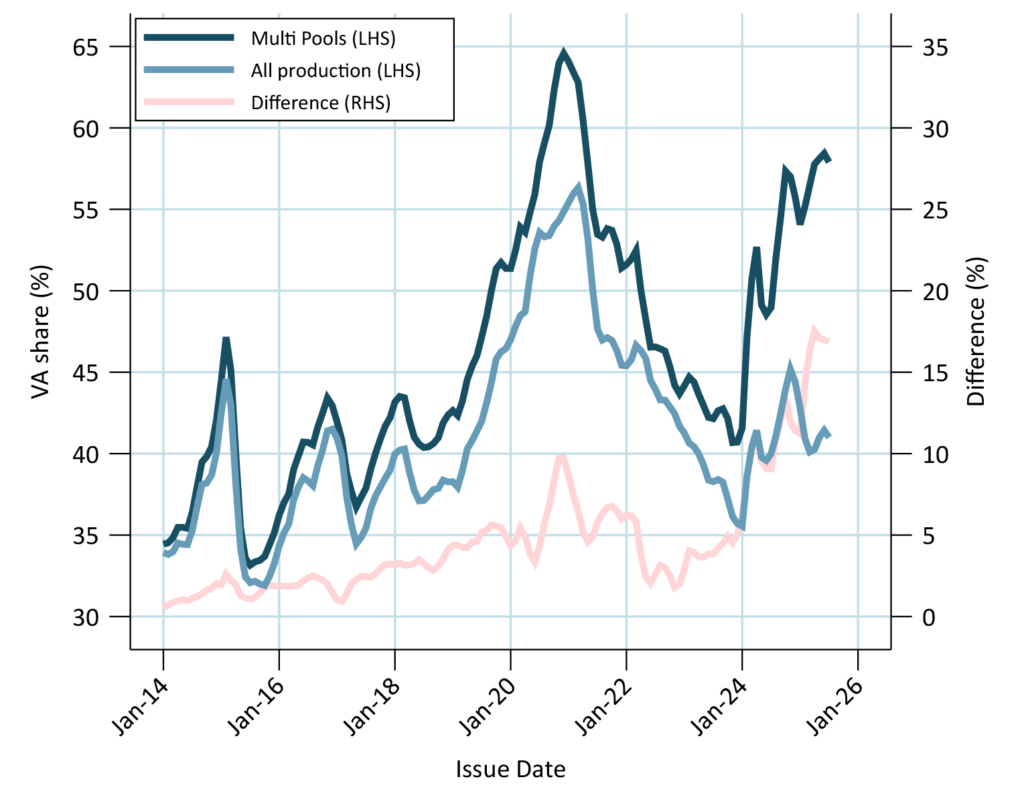
Source: Ginnie Mae, Santander US Capital Markets.
The average loan size of new multiple issuer pools has also widened relative to the average loan size of total issuance (Exhibit 4). For example, the average loan size in June 2025 5.5%s, the largest pool issued that month, was about $422,000. The average over all 5.5% production was about $382,000. Overall, the gap between multi pools and total production was about $15,000 to $25,000 during the pandemic, jumped to about $35,000 in 2023, and recently has approached $50,000.
Exhibit 4. The average loan size of multi pools has jumped since 2022
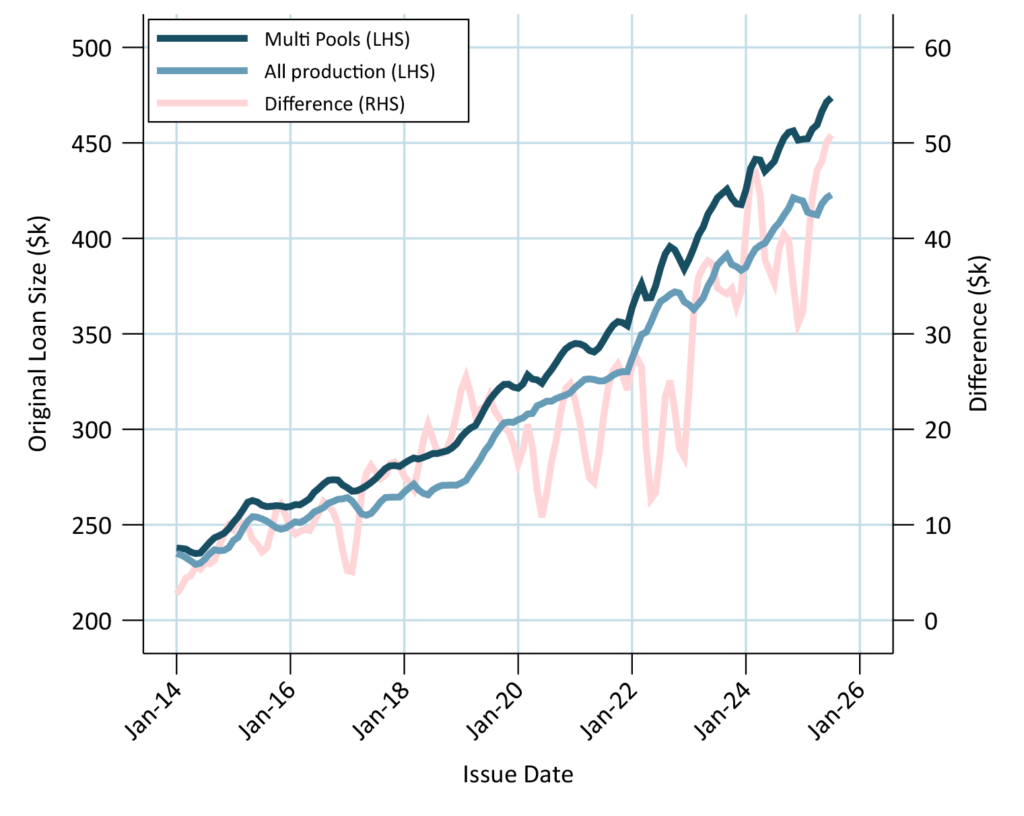
Source: Ginnie Mae, Santander US Capital Markets.
Pay-ups increased as custom issuance increased
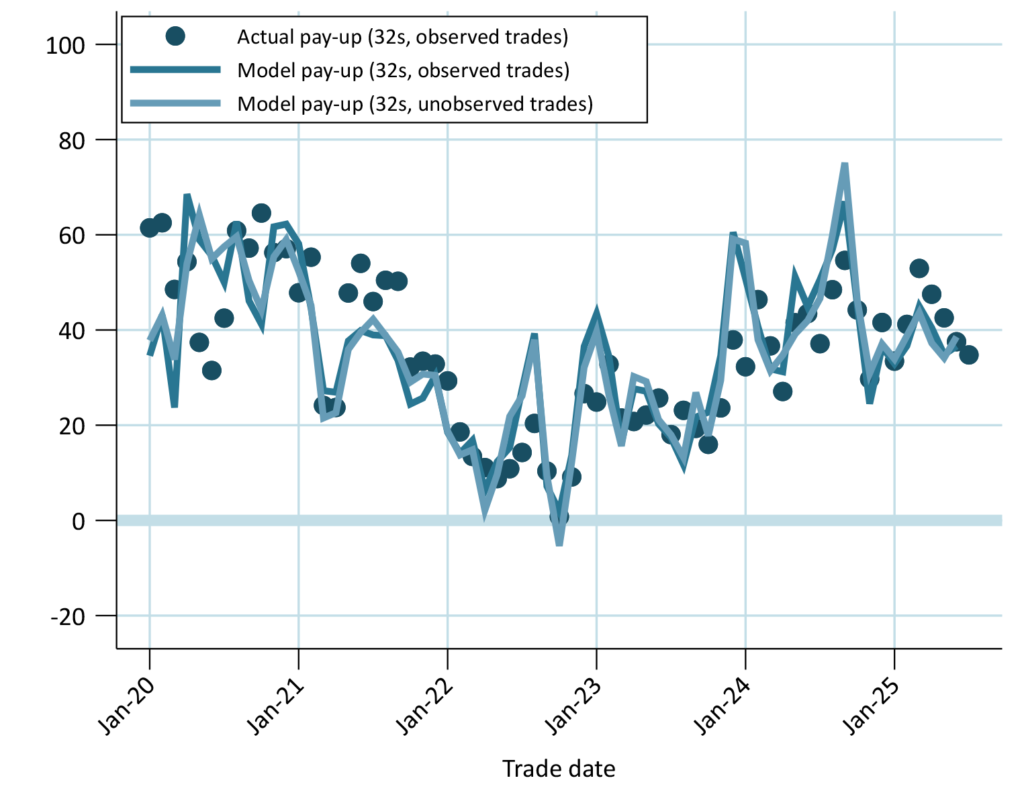
Pay-ups for newly originated custom pools have increased alongside custom pool issuance (Exhibit 5). Lower TBA quality is a likely reason for this. For example, pools with a maximum loan size of $225,000 across all coupons—almost all with high if not exclusive concentrations in FHA loans—traded about 20/32s above TBA in the first three quarters of 2023 but jumped above 32/32s or greater in 2024. Pay-ups peaked in fall 2024 when a drop in rates increased the value of prepayment protection.
Exhibit 5. Pay-ups for Max $225,000 pools have grown as the TBA weakened
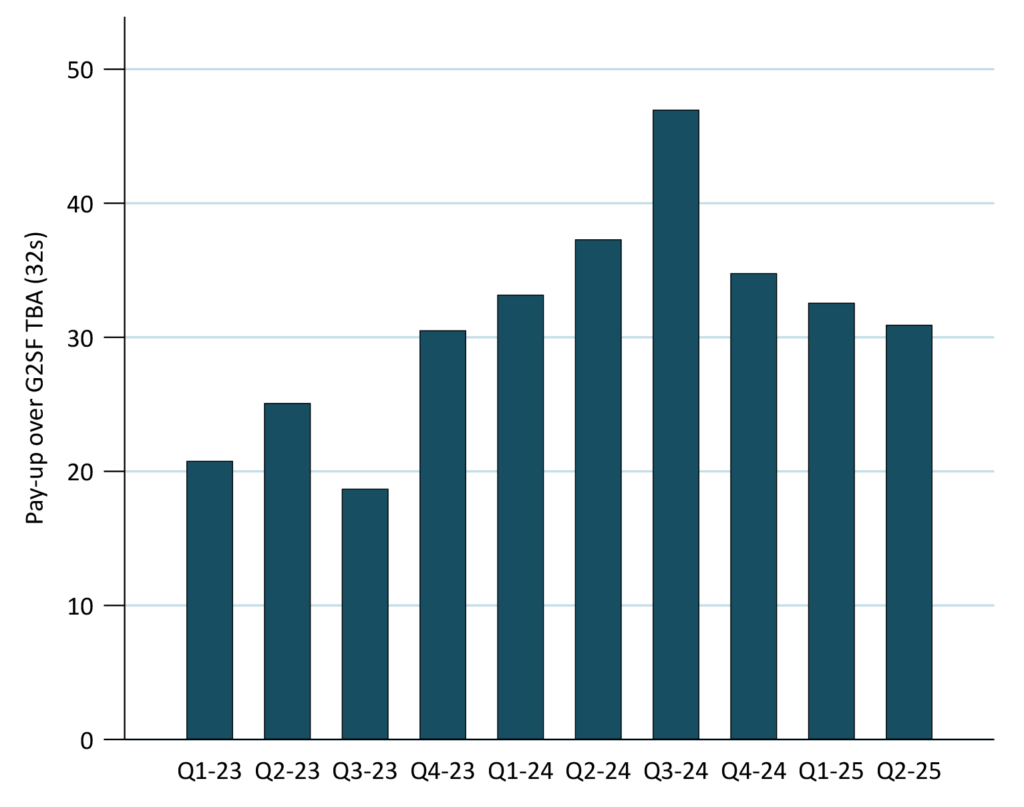
Source: Ginnie Mae, Santander US Capital Markets.
The pattern of rising price premiums to TBA is not just isolated to pools with $225,000 maximum loan balance. It applies to others, as well:
- Various other loan size categories, again concentrated in FHA
- 100% FHA low loan size
- New York, concentrated in FHA
- Florida, concentrated in FHA
In addition, in 2024 originators started creating custom pools with loans, typically FHA, that have maximum loan sizes over $300,000 and going as high as $500,000. Prior to 2024 the pay-up for those loans was non-existent so the pools were not formed.
If Ginnie Mae anticipated that making custom pools ineligible for TBA delivery would discourage them and preserve the size and liquidity of the multi pool, then that element of market design has broken.
Originators should divert more loans from multi pools into customs
Despite the expanding menu of custom pools, originators are still putting loans in multi pools that could command a pay-up to TBA. For example, take the amount of FHA and VA loans of various loan sizes delivered into the June 2025 5.5% multiple issuer pool (Exhibit 6). FHA loans accounted for 31% of the pool. There were 3.1% under $300,000 and another 8% between $300,000 and $400,000. All of these could bring a pay-up. Some may be serviced by fast servicers like Rocket, but their speeds may still be slower than the remaining VA loans.
Exhibit 6. Roughly 30% of the June 5.5% multi pool was FHA loans
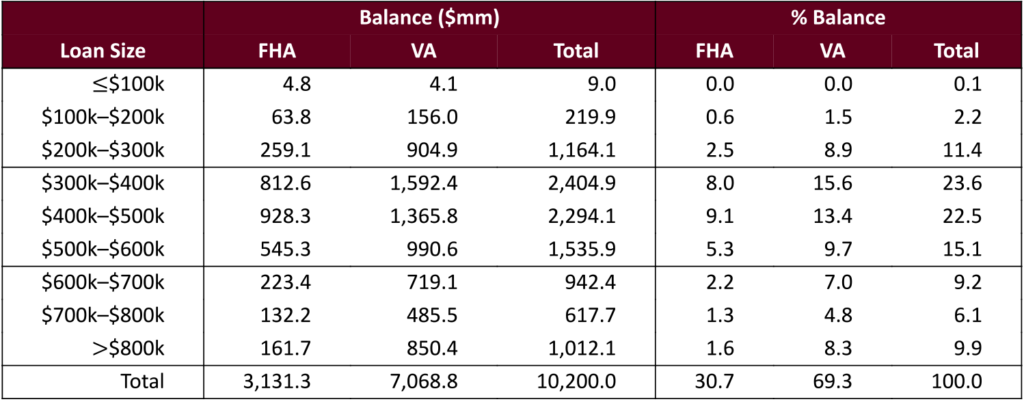
Source: Ginnie Mae, Santander US Capital Markets.
The FHA loans should have much better convexity than the average behavior for this pool. It is useful to look at the potential S-curve for multi pools with different compositions of FHA and VA loans (Exhibit 7). At 100 bp in-the-money the June 5.5% multi pool is expected to prepay around 60 CPR. But the FHA loans in that pool should prepay less than 40 CPR at that level of moneyness. Even FHA loans with balances over $500,000 should only reach 40 CPR. Both are well below the pool average because of the presence of VA loans.
Exhibit 7. Projected S-curves for different FHA and VA concentrations.
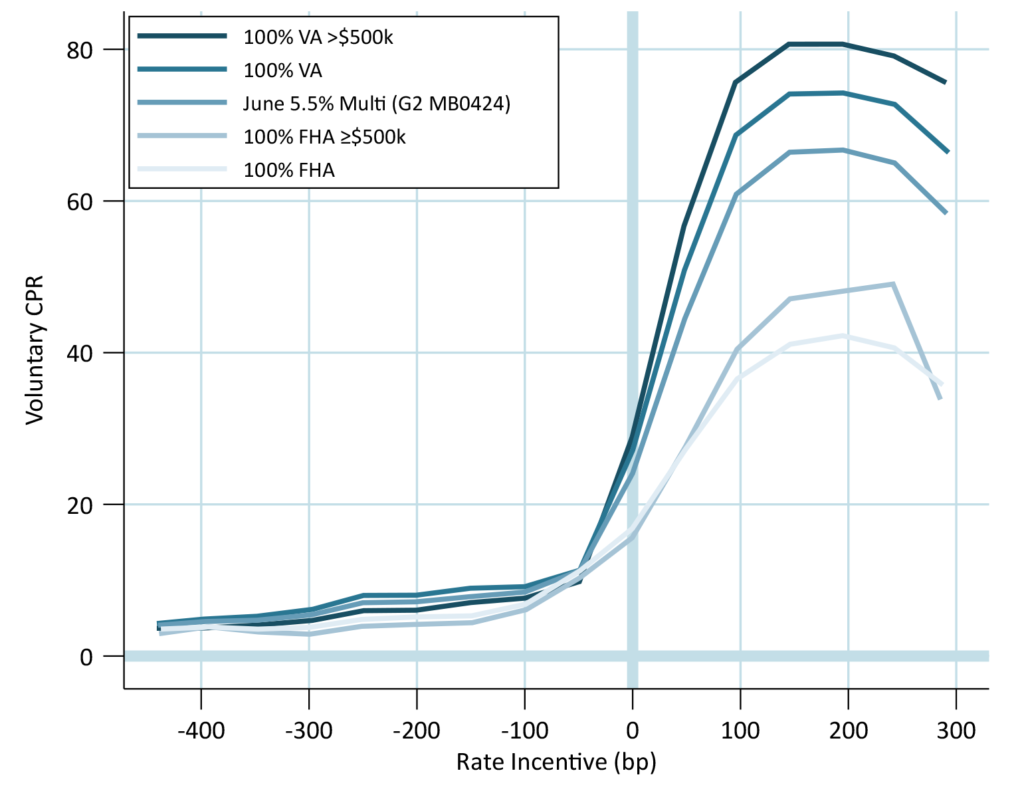
G2 MB0424 is 69% VA, 31% FHA.
Source: Ginnie Mae, Santander US Capital Markets.
If the FHA loans were removed, then the pool would prepay close to 70 CPR when 100 bp in-the-money, which is faster than many of the VA loans in the pool. If VA loans less than $500,000 were removed, then the remaining high-balance VA loans would likely reach 75 CPR.
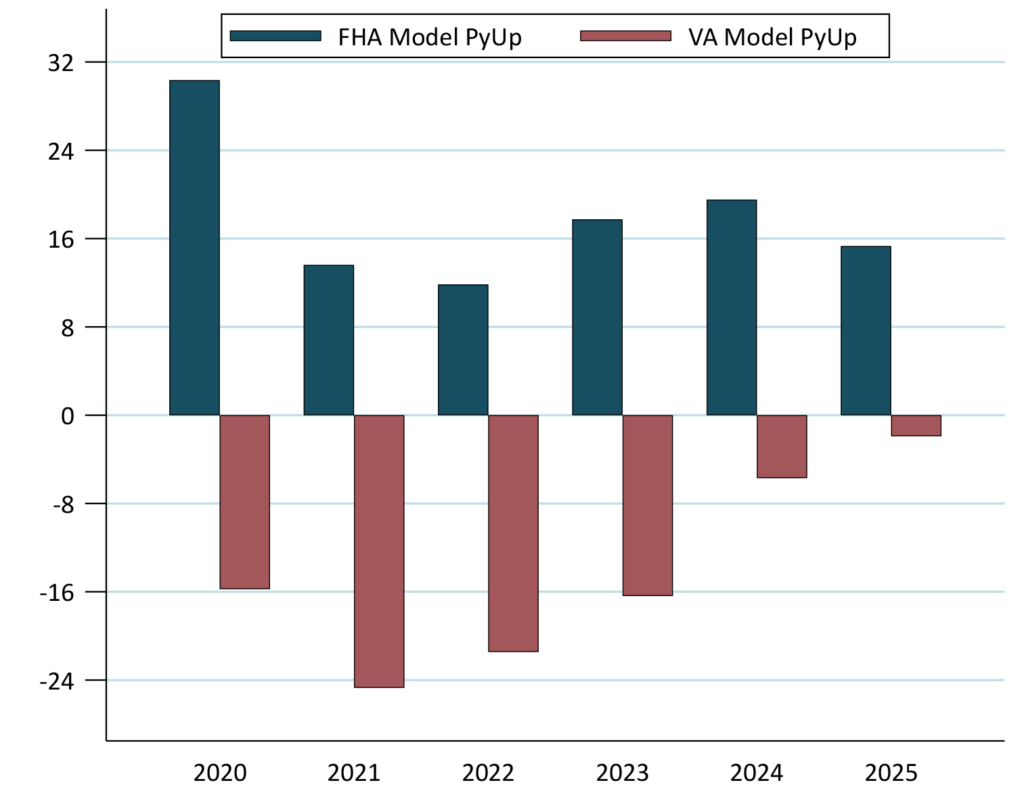
Every year, originators have been putting FHA loans into multi pools that could have been worth more in custom pools (Exhibit 8). Every loan in the multi pools was valued using a model of custom pool pay-ups, described later in an addendum to this note. The average FHA loan in these pools was always worth a premium. Since 2023 these loans, on average, could have earned a premium of more than 15/32s if sold in custom pools. That is more than $1.7 billion on the $364.7 billion of FHA loans put into multi pools over that time.
Exhibit 8. Pay-ups for non-VA loans in multi pools have been increasing
Includes all multiple issuer pools with a coupon greater than or equal to the current coupon at issuance.
Source: Ginnie Mae, Santander US Capital Markets.
And over that time the discount for VA loans in the multi pool has been shrinking mainly because VA loans make up a bigger share of the multi pool. For example, from 2020 through 2022 the VA discount ranged from 16/32s to 24/32s, so the loans were subsidized for about $6.3 billion. But that dropped to about $1 billion for loans delivered in 2023, 2024 and year-to-date in 2025.
The model custom pool pay-ups predicts that almost every FHA loan put into this June’s 5.5% and 6.0% multi pools should have been worth a pay-up (Exhibit 9). The model also predicts pay-ups for low loan balance VA loans. However, there is little direct data on pay-ups for those loans so the model results may be less reliable.
Exhibit 9. Modeled pay-ups for loans put in June 2025 multi pools
Source: Ginnie Mae, Santander US Capital Markets.
Originators should continue to do this—divert the most convex loans from the multi pool into custom pools. Then new multi pools have lower convexity, so the convexity of the remaining loans in the multi pool increases relative to the average. That reinforces incentives for the originator to put the most convex loans that are still in the multi pool into customs. The vicious cycle continues until only the least convex loans are put into multi pools.
This process is the nature of the TBA market and similar markets, a dynamic originally described by economist George Akerlof as a market for lemons. The seller has an information advantage in a TBA market since the seller selects the pools to deliver. Knowing nothing else, the buyer expects to take delivery of the least convex pools. Investors recognize this, so the price of TBA falls to the worst-to-deliver. Loans that have better convexity should be traded separately. So, originators have an incentive to create pools that can trade better than TBA.
The beneficiaries of custom pooling
The trends towards greater custom pool creation raises the question of who benefits. The possibilities include borrowers, originators, dealers and investors.
- Borrowers—The borrower benefits if the pay-up for the specified pool is passed through in the rate sheet. If not, mortgage rates to all Ginnie Mae II borrowers should rise, all else equal, as the multi pool loses convexity.
- Originators—The lender benefits if it retains some of the pay-up for the specified pool rather than passing it to the borrower.
- Dealers—CMO trading desks benefit from the availability of custom pools with diverse prepayment behavior.
- Investors—Pools with prepayment protection can be a better fit for investor portfolios. But smaller production of multi pools may lower TBA liquidity.
Originators, dealers and investors all likely prefer more custom pool production.
For borrowers and the policymakers that represent them, custom pooling could raise mortgage rates for both FHA and VA borrowers equally despite the significant prepayment differences across the programs. Removing convexity from the multi pool should raise mortgage rates for VA borrowers that are currently subsidized by the more convex FHA loans. But if FHA borrowers do not receive the price premium their loans command, then FHA rates would also reflect the VA risk premium.
Possible changes
A variety of parties would have to collaborate for any change to the current state of the Ginnie Mae II market. The current trend seems to benefit most market participants. Whether it helps or hurts borrowers is unclear. The market could go in several directions:
- Do nothing
Perhaps there is no problem to be solved. This evolution is a consequence of TBA markets. Conventional pools have long traded like this, although conventional specified pools have better liquidity since they are TBA-deliverable. - Makes custom pools TBA-deliverable
This would improve custom pool liquidity. Originators have indicated that well-established specified pool stories are incorporated into rate sheets. It is difficult for an originator lock borrowers to a discounted rate if, after closing, the originator must put the loan in a multi pool. Improving the liquidity of custom pools could improve certainty for originators. SIFMA may want to exclude some custom pools from TBA-delivery. For example, perhaps custom pools that contain loans otherwise ineligible for the multi-pool should be excluded. - It may also be possible to help borrowers capture more benefit of the pay-up through disclosure and competition. Borrowers for now likely do not know the potential interest rate advantage from some of their own loan characteristics. For example, perhaps Ginnie Mae could collect and disclose recent market discounts on pools with similar attributes. The borrower could compare the rate offered by the lender to Ginnie Mae’s disclosures and use the information to shop across lenders.
- Prohibit most custom pooling and concentrate liquidity in TBA
Ginnie Mae could prohibit most custom pool creation. For example, it could decide that custom pools can only be used for loans that are ineligible for multi pool delivery, like certain VA cash-out refinances, or originators that are not allowed to use the multi pool. This would force most loans into the multi pool, improving liquidity but eliminating any value created by custom pooling.
To be or not to be
The dramatic growth of Ginnie Mae custom pooling is reshaping the Ginnie Mae MBS market. The liquidity disadvantage of custom pools is no longer inhibiting custom pool creation, since the prepayment and value difference between FHA and VA loans is so large. Without intervention the convexity of the TBA may continue to spiral downhill. Market participants need to consider the effect on borrowers and decide whether to let this trend continue or encourage action to tilt the market in a different direction.
Addendum: Pay-up Model
The pay-up model was estimated using the prices investors paid originators for new custom pools, from January 2020 through May 2025. These attributes of custom pools were used in the model, and account for most custom pool trades:
- Percent FHA, VA and rural housing
- Average loan size
- New York pools
- Certain servicers—Freedom, PennyMac, Rocket, and United Shore
VA cash-out refinance custom pools, which trade behind TBA, were included.
The model also incorporates TBA attributes, since the value of the TBA influences the pay-up:
- Percent FHA, VA and rural housing
- Average loan size
- Duration
- OAS
- Refinance incentive, measured as net coupon spread to current coupon
This model can be used to estimate the pay-up for custom pools at issuance, whether they were in the Santander database (Exhibit 10). This shows the average monthly pay-up for Max $200k pools in the database, the model’s prediction for those pay-ups and the model’s prediction of the pay-up for the custom pools absent from the database.
Exhibit 10. Predicted vs. actual pay-ups for Max $200k custom pools
Source: Ginnie Mae, Santander US Capital Markets.
Addendum: Borrowers’ note rates
Policymakers are concerned whether any of the pay-up is passed through to the borrower. If the premium is passed to borrowers, then more custom issuance and higher pay-ups for those pools should lower the note rate given to those borrowers relative to the average FHA borrower, all-else-equal.
Since there was little custom pooling in 2014, the note rates in that year should reflect what borrowers receive in the absence of a pay-up. It is a good baseline.
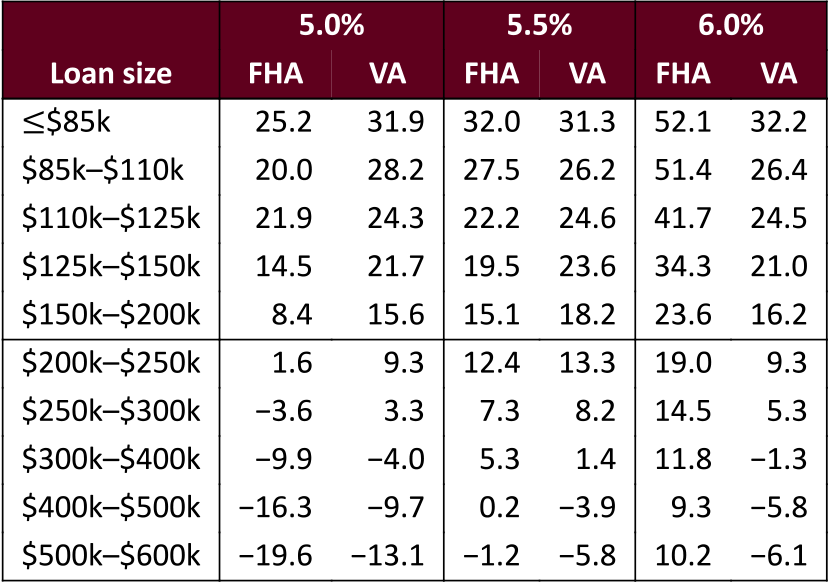
However, the note rate spread grew over time (Exhibit 11). The chart calculates the spread in each month of origination for borrowers in different size loans to the average rate of all loans originated in each month, then bucketed into years with similar behavior. For example, from 2014 to 2018 FHA LLB borrowers (loans no more than $85,000) paid a note rate just under 20 bp higher than the average. But the spread widened to 50 bp in 2025, even though most of these loans are now put into custom pools. The spread widened over time in nearly every loan size bucket.
Exhibit 11. The rate premium paid by low balance FHA borrowers has grown
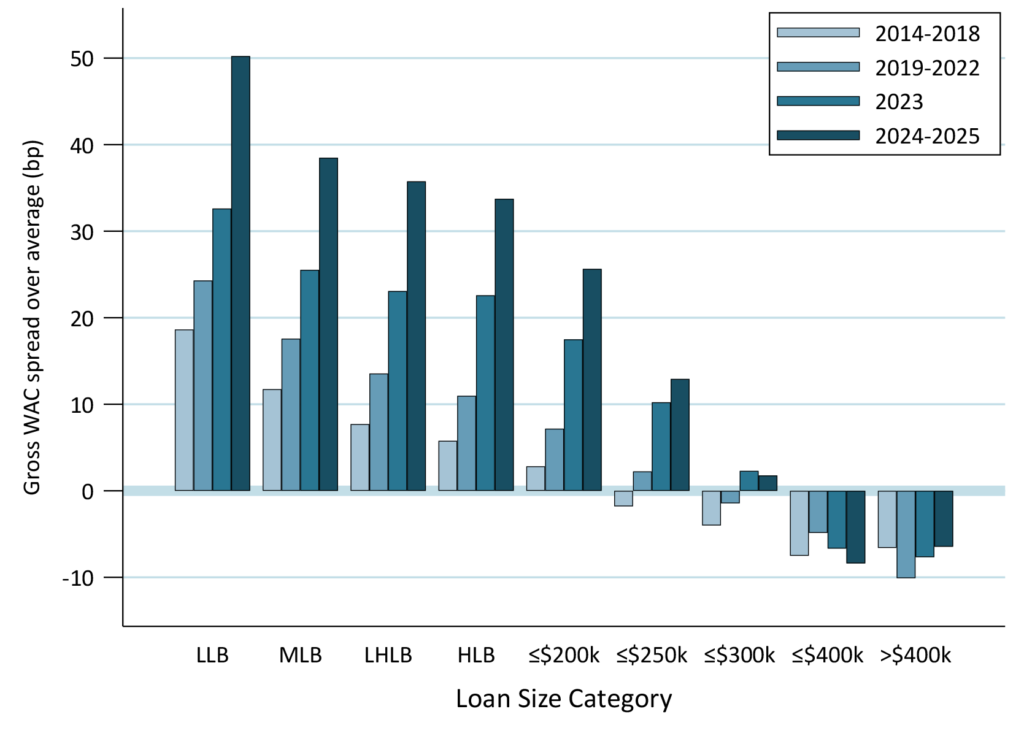
FHA loans, single-unit properties. Each loan’s gross wac is compared to the average gross wac of all loans originated that month. Loans are grouped by origination vintage into three groups, results were similar for each vintage with a given bucket. Loan modifications are excluded. Categories exclude loans in the smaller categories. For example, “≤$200k” mean $150k<loan size≤$200k.
Source: Ginnie Mae, Santander US Capital Markets.
The growing spread suggests the “all-else-equal” assumption was invalid—there must be confounding factor(s) that explain the spread widening. For example, as home prices increased the credit risk of the borrower receiving the smallest loans may have weakened. Another possibility is that the fixed costs to originate a mortgage became a smaller portion of the total cost to the average borrower as loan sizes increased, pulling the average rate down and widening the spread.
The analysis is inconclusive but raises concern since the sharp increase in custom pooling and higher pay-ups did not have an obvious effect on improving mortgage rates for small loans.