


The Big Idea
Relative value looks different from the swap curve
Steven Abrahams | July 18, 2025
This material is a Marketing Communication and does not constitute Independent Investment Research.
A lot of debt looks tight to the Treasury curve these days. Agency debt, MBS, CMBS, corporate credit all belong to that club. But take a look at the world from the swap curve. Things look very different. From the swap curve, a lot of debt looks much wider and more attractive. That should get the attention of banks, FHLBanks, REITs, hedge funds and other portfolios able to capture spread to the swap curve. Those portfolios have a range of good choices in the market.
Assets tight to the Treasury curve, wider to the swap curve
Let’s start with US agency debt, which is only one shade of credit risk removed from Treasury debt itself. Using the market index of agency debt as a benchmark, the option-adjusted spread to the Treasury curve sits these days near 11 bp, wider than only 35% of sessions in the last five years (Exhibit 1). Against the SOFR swap curve, however, OAS stands at 40 bp, wider than 96% of sessions in the last five years. A little tight to the Treasury curve, very wide to swaps.
Exhibit 1: Agency debt trades a little tight to Treasury debt, wide to swaps
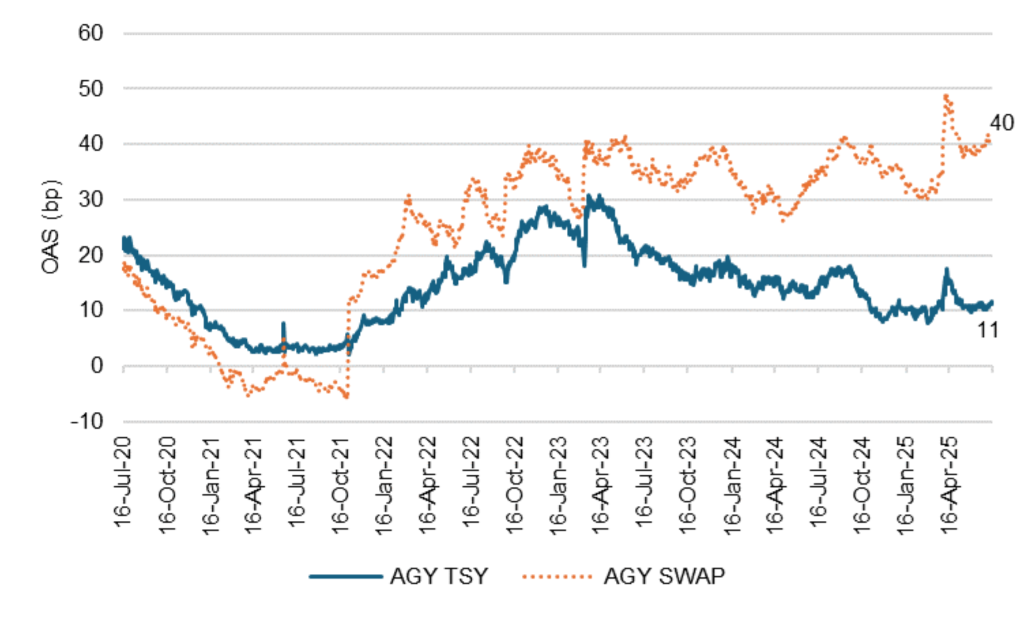
Note: OAS reflects the LUAATRUU index.
Source: Bloomberg, Santander US Capital Markets.
Moving to agency CMBS, where the credit risk matches agency debt but the cash flows reflect other influences—defeasance, prepayment, yield maintenance and default—the view also varies from Treasury to swaps. The agency CMBS index lately trades at an OAS to the Treasury curve of 36 bp, wider than only 26% of sessions in the last five years. But the index trades at an OAS to swaps of 72 bp, wider than 74% of sessions. A little tight to Treasury, wide to swaps.
Exhibit 2: Agency CMBS also trades a little tight to Treasury debt, wide to swaps
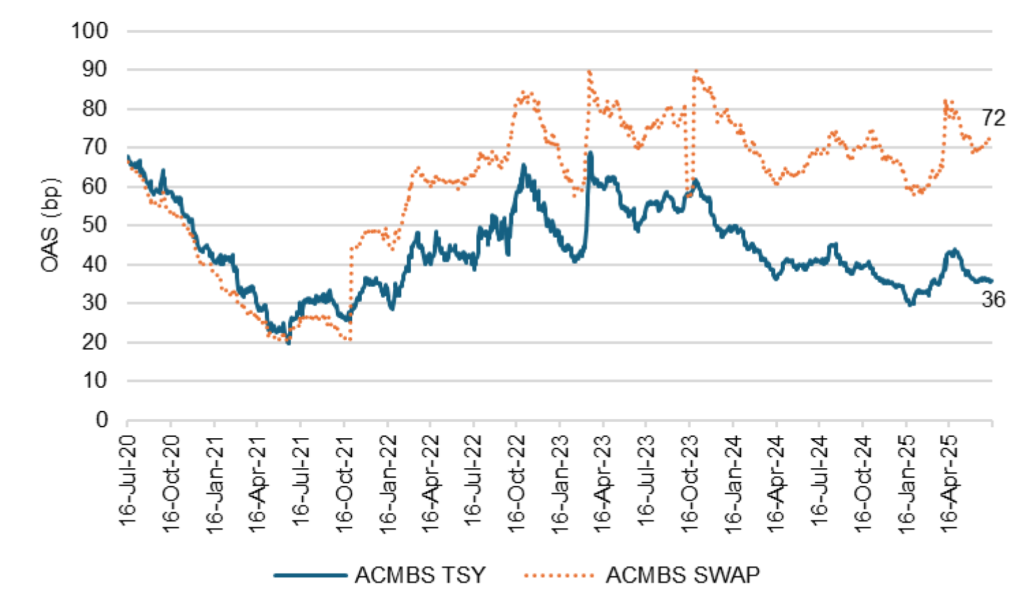
Note: OAS reflects the BAGETRUU index.
Source: Bloomberg, Santander US Capital Markets.
In agency MBS, credit risk matches other agency assets, but prepayment risk dominates. Here the index OAS to Treasury sits at 36 bp, wider than only 31% of sessions in the last five years (Exhibit 3). OAS to swaps sits at 91, wider than 85% of sessions. Tight to Treasury, wide to swaps again.
Exhibit 3: Agency MBS trades a little tight to Treasury, very wide to swaps
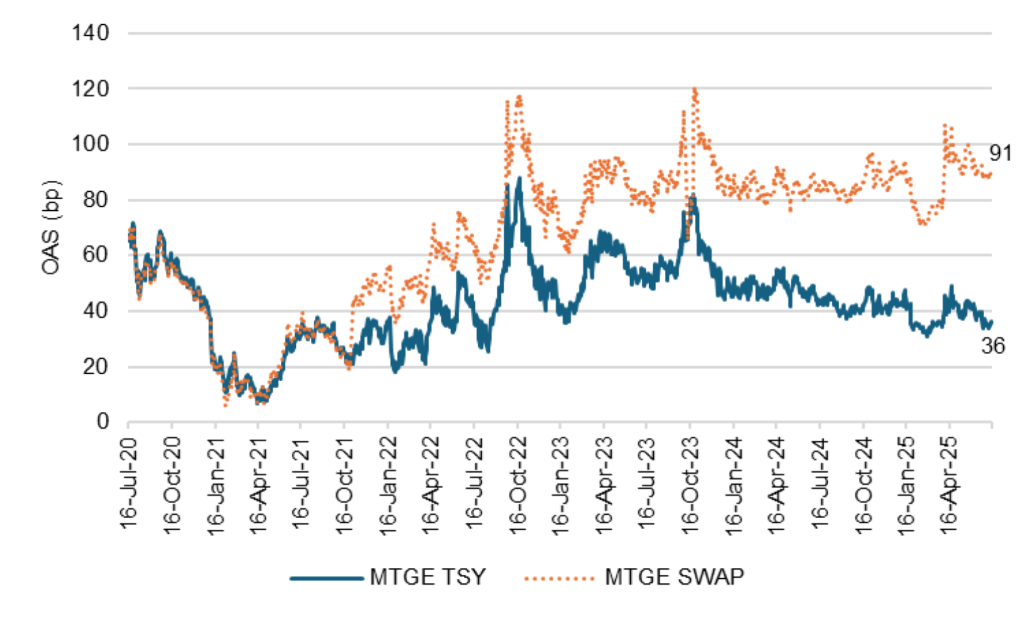
Note: OAS reflects the LUMSTRUU index.
Source: Bloomberg, Santander US Capital Markets.
Last, investment grade corporate credit, which is predominately an interest rate rather than a credit exposure. Here the index OAS to Treasury sits at 78 bp, wider than only 4% of sessions in the last five years (Exhibit 4). The index OAS to swaps comes in at 129 bp, wider than 41% of sessions. Very tight to Treasury, modestly tight to swaps.
Exhibit 4: Investment grade trades very tight to Treasury, a little tight to swaps
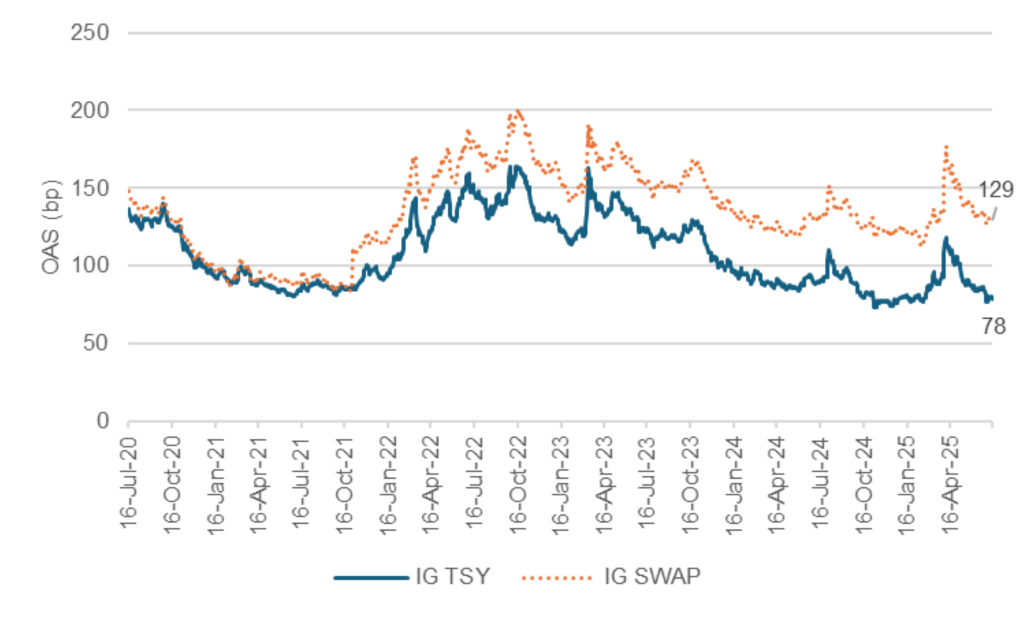
Note: OAS reflects the LUACTRUU index.
Source: Bloomberg, Santander US Capital Markets.
The Treasury curve has widened faster than other risk assets
What all these markets reflect is that the Treasury market itself has slowly become a risk asset. Steady federal deficits and a rising cost of debt service have added risk premium to the Treasury curve for years. That the case made here and here, among other places. More risk premium has come this year. Fiscal pressure has continued with the One Big Beautiful Bill Act along with new volatility in US trade and other policy and political pressure on the Fed. This adds risk to the Treasury curve, and the longer the maturity, the more risk. Rather than risk assets tightening against the Treasury curve, the Treasury curve has widened toward risk assets. Almost everything, including Treasury debt, has widened to swaps. Swaps have become a credit-free debt curve relatively unswayed by supply or other sovereign risks.
Capturing the spread to swaps
The market opportunity is for portfolios that can potentially capture the spread between these sectors and the swap curve. On the list:
- Banks, which often fund at deposit rates below SOFR and can buy fixed-rate Treasury and agency debt, agency CMBS and MBS and swap them to floating—or partially swap them to floating, in the case of MBS, through a portfolio layer hedge
- The FHLBanks, which fund slightly above SOFR, can do the same
- REITs and hedge funds, which fund modestly above SOFR in the repo markets, can also hedge fixed-rate assets to floating
Even though swapping a position to floating reduces mark-to-market interest rate risk, the big caveat for all these positions is mark-to-market spread risk. If the asset spread to the swap curve continues to widen, the position will take a mark-to-market loss. The more leveraged the position, the bigger the mark-to-market loss as a share of position equity.
The gap between risk assets and swaps looks likely to continue widening for now. The forces that have widened the Treasury curve and other markets to swaps so far still have momentum. A leveraged, hedged position can generate carry and return on equity, but mark-to-market spread risk can take some or all of it back.
For the broader market, the widening gap between risk assets and swaps should give funded and hedged positions more carry and potential return on equity to help cushion mark-to-market risk. That should draw more capital into risk assets. Yes, lots of debt looks tight to the Treasury curve. But once the Treasury curve gets lumped in with other risk assets, a new set of opportunities opens up.
* * *
The view in rates
The market traded on Friday pricing fed funds at 3.86% to end the year, only 1 bp below the Fed’s June dots. The strong employment report for June has given the Fed some room to wait. And the Fed looks prepared to wait until it has a better view of whether tariffs will bring a 1-time price change or more persistent inflation. Presumably, any inflation impact from tariffs should start to play out in July and August. The market seems to believe the inflation impact will be muted or temporary or both with fed funds lower by the end of the year as a result.
A steady diet of tariff headlines has kept longer Treasury rates high relative to the swap curve. Add to that the steady pressure on the Fed and a debt-to-GDP ratio at 100% and expected to grow over the next decade to 124% after passage of the One Big Beautiful Bill Act. It all promises to add term premium to the yield curve, steepening the curve.
Other key market levels:
- Fed RRP balances settled recently at $199 billion, fairly elevated for a mid-month reading this year.
- Setting on 3-month term SOFR closed Friday at 432 bp, unchanged in the last week.
- Further out the curve, the 2-year note traded Friday at 3.87%, down 2 bp in the last week. The 10-year note traded at 4.42%, unchanged in the last week.
- The Treasury yield curve traded Friday with 2s10s at 55 bp, steeper by 3 bp in the last week. The 5s30s traded Friday at 104 bp, steeper by 7 bp over the same period
- Breakeven 10-year inflation traded Friday at 242 bp, up 4 bp in the last week. The 10-year real rate finished the week at 198 bp, down 4 bp in the last week.
The view in spreads
The market has absorbed the Israel-Iran conflict, the One Big Beautiful Bill Act and a new round of tariff threats surprisingly well, implying that broad risk to the global economy is nevertheless limited. Spreads look relatively tight against the Treasury curve. That seems to give a lot of weight to some benign outcome to the tariff standoff between the US and dozens of its trading partners. The targeted counterparties could come to some temporary broad agreement, could extend discussion into another deferral or could get hit with tariffs and then watch them get deferred after a bad market reaction. Any of those scenarios are consistent with current spreads. That helps risk assets continue to hold their ground against the Treasury curve. The Bloomberg US investment grade corporate bond index OAS traded on Friday at 78 bp, tighter by 2 bp in the last week. Nominal par 30-year MBS spreads to the blend of 5- and 10-year Treasury yields traded Friday at 149 bp, wider by 3 bp in the last week. Par 30-year MBS TOAS closed Friday at 34 bp, unchanged in the last week.
The view in credit
A wide range of specific industries and individual companies still have exposure to tariff risk, but fundamentals for the average of the distribution continue to look stable. Most investment grade corporate and most consumer balance sheets have fixed-rate funding so falling rates have limited immediate effect. Consumer debt service coverage is roughly at 2019 levels. However, serious delinquencies in FHA mortgages and in credit cards held by consumers with the lowest credit scores have been accelerating. Consumers in the lowest tier of income look vulnerable, and renewed student payments and cuts to government programs should keep the pressure on. The balance sheets of smaller companies show signs of rising leverage and lower operating margins. Leveraged loans also are showing signs of stress, with the combination of payment defaults and liability management exercises, or LMEs, often pursued instead of bankruptcy, back to 2020 post-Covid peaks. If the Fed only eases slowly this year, fewer leveraged companies will be able to outrun interest rates, and signs of stress should increase. LMEs are very opaque transactions, so a material increase could make important parts of the leveraged loan market hard to evaluate.