By the Numbers
Enhancing returns with CMO barbells
This material is a Marketing Communication and does not constitute Independent Investment Research.
Last week’s strong employment and payroll data reduced market expectations of Fed rate cuts and pushed long rates higher. The move should broadly help CMO floater carry and create an attractive entry point for longer-duration CMOs. Attractive relative value in both floating- and fixed-rate CMOs creates opportunity to match the duration of shorter fixed-rate pass-throughs through a CMO barbell. Valuing several versions of this trade suggests that pairing 7.0% cap floaters with 5.0% last-cash-flow CMOs can offer attractive spread and return.
The Fourth of July holiday kicked off with some early fireworks in the form of both higher-than-expected job creation and lower unemployment in the June nonfarm payroll and unemployment releases. These readings roughly halved expectations of Fed rate cuts this year. Early last week the market had fully priced in nearly 70 bp of cuts by December, but current market-implied expectations hover around 37 bp.
Concurrently, 10-year treasury yields rose by as much as 15 bp. In confluence, the two moves have created an attractive opportunity for investors, particularly depositories or other asset liability managers to pair floating and fixed-rate cash flows to replicate a duration profile comparable to shorter fixed-rate cash flows. But while the net effective duration of the paired exposures will be the same as the pass-through, the key rate exposures will differ materially, creating the potential for the barbell to outperform given changes in the shape of the yield curve.
Loading up the barbell
Investors in floating-rate CMOs have options when it comes to both the cap they are willing to short and the collateral backing the bond. The market currently commonly offers floater caps ranging from 6.5% to 8.0%, and bonds can be backed by more positively convex profiles like loan balance or more negatively convex TBA-like collateral. Floaters with 7.0% caps backed by more convex collateral profiles appear to strike an attractive balance of current carry and OAS while still providing protection against a further rise in rates and steepening of the yield curve.
Given this, the analysis is anchored on a 7.0% cap floater backed by $300,000 max loan balance collateral and paired with several longer duration exposures, including CMO last cash flows with various coupons, deep discount TBAs and specified pools. The profiles are then paired to match the effective duration of UMBS 15-year 5.0% TBA, 2.75 years. Admittedly, the benchmark carries a fairly full valuation given a long-standing negative net supply technical in 15-year issuance. However, the TBA provides both a par-priced benchmark that should closely track the duration that many depository portfolios are managing to and a standard by which the relative performance of the paired trades can be measured against.
Measuring relative value
Constructing the barbell requires solving for a blend of floaters and last cash flow bonds that will be both duration and market value proceeds neutral to an exposure to 15-year 5.0% TBA. Targeting an invested market value of $100 million with a net duration of 2.74 years, equivalent to the effective duration of UMBS 15-year 5.0% TBA, would imply a $76.1 million floater investment paired with a $23.9 million investment in a 5.0% CMO last cash flow bond. The paired trade offers substantially more nominal spread, comparable option cost and better convexity than the investment in the 15-year pass through (Exhibit 1).
Exhibit 1: Building a barbell out of CMO floaters and last cash flows
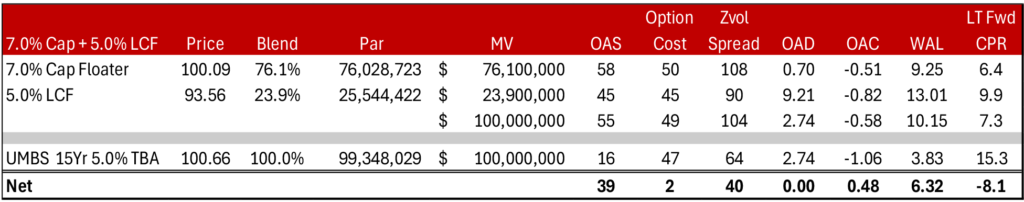
Source: Santander US Capital Markets, YieldBook
Pairing the 7.0% cap $300,000 max floater, which offers 58 bp of SOAS, with a 5.0% coupon last-cash flow backed by investor collateral, which offers 45 bp of TOAS. at a ratio of roughly a 3:1 ratio of floaters to last cash flows generates a weighted average OAS of 55 bp or a 39 bp OAS advantage over the benchmark, the most meaningful OAS pick of all paired trades analyzed (Exhibit 2).
Exhibit 2: Weighing the OAS and convexity advantage of the barbells
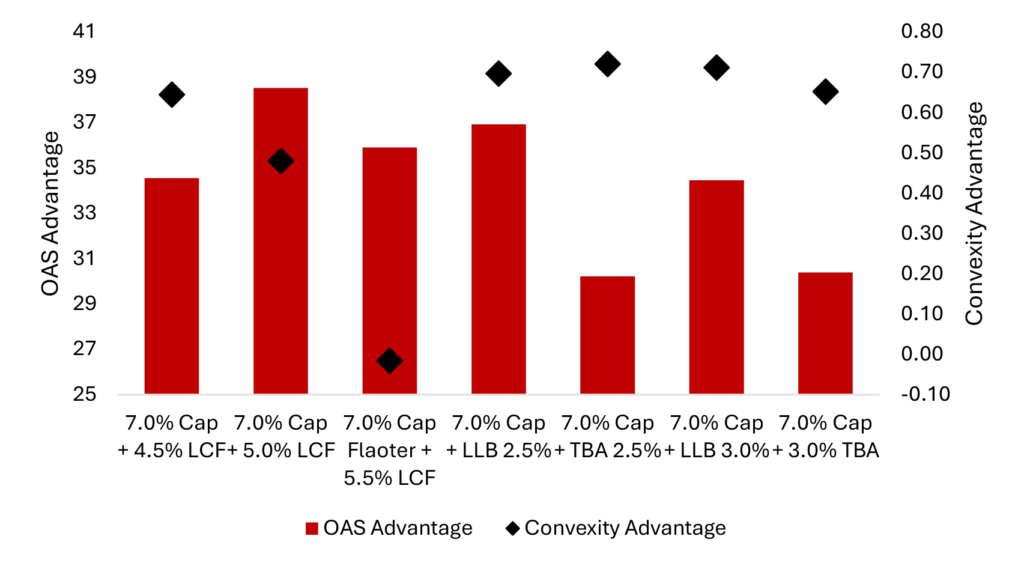
Source: Santander US Capital Markets, YieldBook
The 5.0% LCF also offers a comparable convexity advantage over the benchmark as the deeper discount LCF and the 2.5% and 3.0% pass throughs. The roughly 60 bp of OAS on the floater should look attractive for depositories who are currently asset swapping Treasuries back to a floating rate coupon. Looking at the term SOFR swap curve, banks would have swap Treasury maturities in excess of 10-years to generate a comparable spread to the floater OAS, meaning they would be taking on significantly more spread duration risk than that of the floater.
In addition to offering the greatest OAS advantage, pairing 7.0% floaters with 5.0% last cash flows can offer an attractive total return advantage over the benchmark given changes in the shape of the yield curve (Exhibit 2). While 5.5% coupon LCF will offer a marginally better return advantage into both bull and bear steepeners, they underperform the deeper discount sequential potions into any flattening of the yield curve. The 5.5% coupon option is also the most negatively convex, evident in the bond’s substantial underperformance relative to other exposures into any substantial rally or sell-off. Comparing the 5.0% LCF barbell with the pass-through exposures shows that the sequential offers fairly meaningful outperformance across all modeled scenarios when stacked up against both deep discount loan balance pools and TBAs (Exhibit 3).
Exhibit 3: Stacking up barbelled total return advantages
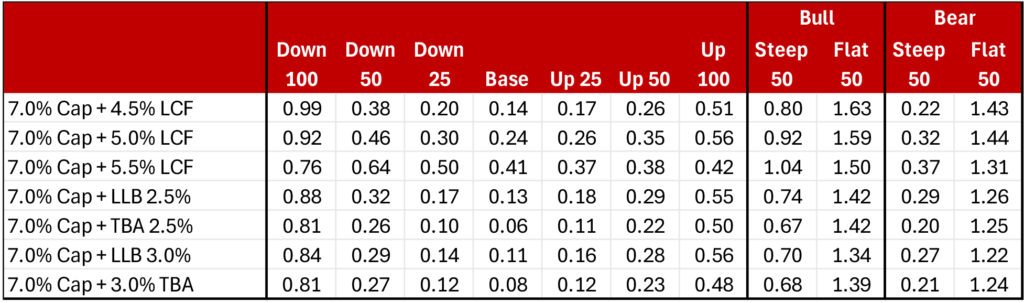
Source: Santander US Capital Markets, YieldBook
This material is intended only for institutional investors and does not carry all of the independence and disclosure standards of retail debt research reports. In the preparation of this material, the author may have consulted or otherwise discussed the matters referenced herein with one or more of SCM’s trading desks, any of which may have accumulated or otherwise taken a position, long or short, in any of the financial instruments discussed in or related to this material. Further, SCM may act as a market maker or principal dealer and may have proprietary interests that differ or conflict with the recipient hereof, in connection with any financial instrument discussed in or related to this material.
This message, including any attachments or links contained herein, is subject to important disclaimers, conditions, and disclosures regarding Electronic Communications, which you can find at https://portfolio-strategy.apsec.com/sancap-disclaimers-and-disclosures.
Important Disclaimers
Copyright © 2026 Santander US Capital Markets LLC and its affiliates (“SCM”). All rights reserved. SCM is a member of FINRA and SIPC. This material is intended for limited distribution to institutions only and is not publicly available. Any unauthorized use or disclosure is prohibited.
In making this material available, SCM (i) is not providing any advice to the recipient, including, without limitation, any advice as to investment, legal, accounting, tax and financial matters, (ii) is not acting as an advisor or fiduciary in respect of the recipient, (iii) is not making any predictions or projections and (iv) intends that any recipient to which SCM has provided this material is an “institutional investor” (as defined under applicable law and regulation, including FINRA Rule 4512 and that this material will not be disseminated, in whole or part, to any third party by the recipient.
The author of this material is an economist, desk strategist or trader. In the preparation of this material, the author may have consulted or otherwise discussed the matters referenced herein with one or more of SCM’s trading desks, any of which may have accumulated or otherwise taken a position, long or short, in any of the financial instruments discussed in or related to this material. Further, SCM or any of its affiliates may act as a market maker or principal dealer and may have proprietary interests that differ or conflict with the recipient hereof, in connection with any financial instrument discussed in or related to this material.
This material (i) has been prepared for information purposes only and does not constitute a solicitation or an offer to buy or sell any securities, related investments or other financial instruments, (ii) is neither research, a “research report” as commonly understood under the securities laws and regulations promulgated thereunder nor the product of a research department, (iii) or parts thereof may have been obtained from various sources, the reliability of which has not been verified and cannot be guaranteed by SCM, (iv) should not be reproduced or disclosed to any other person, without SCM’s prior consent and (v) is not intended for distribution in any jurisdiction in which its distribution would be prohibited.
In connection with this material, SCM (i) makes no representation or warranties as to the appropriateness or reliance for use in any transaction or as to the permissibility or legality of any financial instrument in any jurisdiction, (ii) believes the information in this material to be reliable, has not independently verified such information and makes no representation, express or implied, with regard to the accuracy or completeness of such information, (iii) accepts no responsibility or liability as to any reliance placed, or investment decision made, on the basis of such information by the recipient and (iv) does not undertake, and disclaims any duty to undertake, to update or to revise the information contained in this material.
Unless otherwise stated, the views, opinions, forecasts, valuations, or estimates contained in this material are those solely of the author, as of the date of publication of this material, and are subject to change without notice. The recipient of this material should make an independent evaluation of this information and make such other investigations as the recipient considers necessary (including obtaining independent financial advice), before transacting in any financial market or instrument discussed in or related to this material.
Important disclaimers for clients in the EU and UK
This publication has been prepared by Trading Desk Strategists within the Sales and Trading functions of Santander US Capital Markets LLC (“SanCap”), the US registered broker-dealer of Santander Corporate & Investment Banking. This communication is distributed in the EEA by Banco Santander S.A., a credit institution registered in Spain and authorised and regulated by the Bank of Spain and the CNMV. Any EEA recipient of this communication that would like to affect any transaction in any security or issuer discussed herein should do so with Banco Santander S.A. or any of its affiliates (together “Santander”). This communication has been distributed in the UK by Banco Santander, S.A.’s London branch, authorised by the Bank of Spain and subject to regulatory oversight on certain matters by the Financial Conduct Authority (FCA) and the Prudential Regulation Authority (PRA).
The publication is intended for exclusive use for Professional Clients and Eligible Counterparties as defined by MiFID II and is not intended for use by retail customers or for any persons or entities in any jurisdictions or country where such distribution or use would be contrary to local law or regulation.
This material is not a product of Santander´s Research Team and does not constitute independent investment research. This is a marketing communication and may contain ¨investment recommendations¨ as defined by the Market Abuse Regulation 596/2014 ("MAR"). This publication has not been prepared in accordance with legal requirements designed to promote the independence of research and is not subject to any prohibition on dealing ahead of the dissemination of investment research. The author, date and time of the production of this publication are as indicated herein.
This publication does not constitute investment advice and may not be relied upon to form an investment decision, nor should it be construed as any offer to sell or issue or invitation to purchase, acquire or subscribe for any instruments referred herein. The publication has been prepared in good faith and based on information Santander considers reliable as of the date of publication, but Santander does not guarantee or represent, express or implied, that such information is accurate or complete. All estimates, forecasts and opinions are current as at the date of this publication and are subject to change without notice. Unless otherwise indicated, Santander does not intend to update this publication. The views and commentary in this publication may not be objective or independent of the interests of the Trading and Sales functions of Santander, who may be active participants in the markets, investments or strategies referred to herein and/or may receive compensation from investment banking and non-investment banking services from entities mentioned herein. Santander may trade as principal, make a market or hold positions in instruments (or related derivatives) and/or hold financial interest in entities discussed herein. Santander may provide market commentary or trading strategies to other clients or engage in transactions which may differ from views expressed herein. Santander may have acted upon the contents of this publication prior to you having received it.
This publication is intended for the exclusive use of the recipient and must not be reproduced, redistributed or transmitted, in whole or in part, without Santander’s consent. The recipient agrees to keep confidential at all times information contained herein.


