


The Big Idea
Credit comes out of the second quarter with momentum
Steven Abrahams | July 11, 2025
This material is a Marketing Communication and does not constitute Independent Investment Research.
Despite the volatility of Liberation Day, credit has come out of the second quarter with momentum. In fact, all risk assets beat the Treasury market in the run from March to June. If the new US approach to trade and other policy has put a dent in the Treasury market’s role as global safe haven, then the risk of suddenly widening to the Treasury curve has diminished, too. Adding to both credit and MBS exposure looks like a reasonable next step.
Credit has momentum
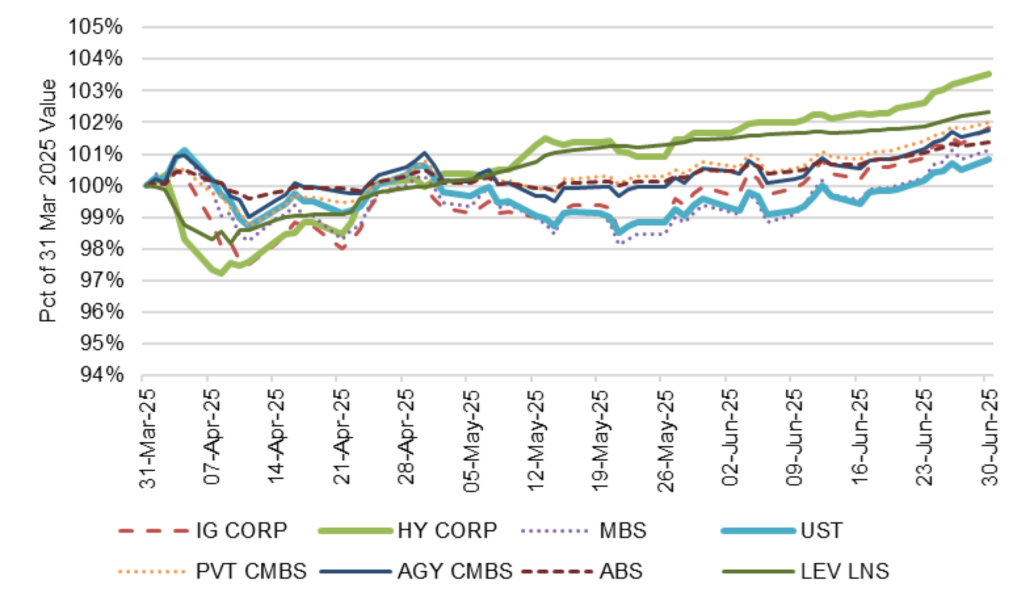
Once again, credit has momentum. Total returns from high yield and leverage loans topped fixed income from March through June while rates products trailed. Every sector lost ground after Liberation Day, but the 90-day pause on reciprocal tariffs opened the door to a rebound. And rebound they did. High yield posted 3.53% returns for the quarter with leveraged loans at 2.31%. Private CMBS followed with 2.00% and agency CMBS at 1.76%. ABS posted 1.38%, agency MBS posted 1.14% and Treasury debt trailed at 0.85% (Exhibit 1).
Exhibit 1: Credit rebounded from Liberation Day to lead second quarter returns
Source: Bloomberg, Santander US Capital Markets
Relatively higher return for the risk taken
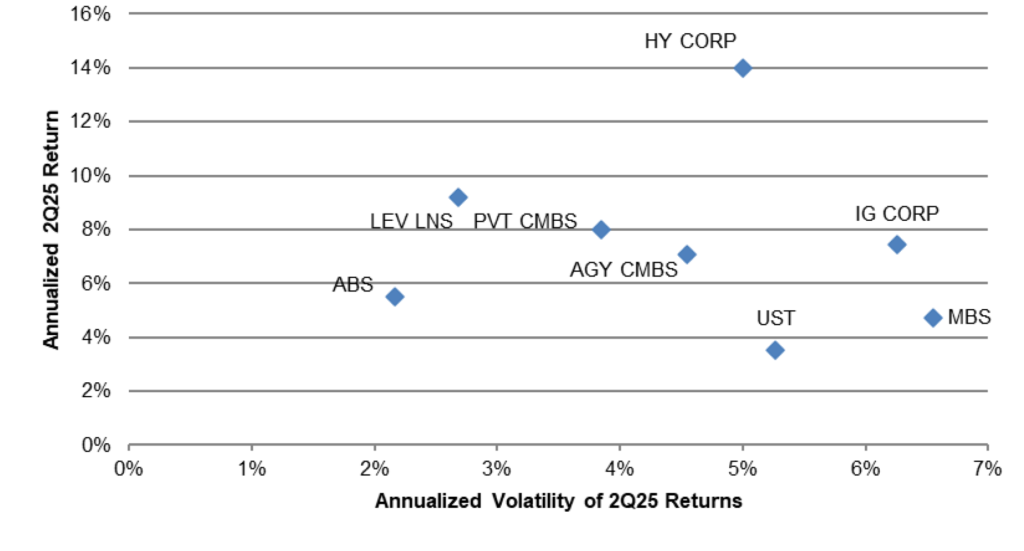
The volatility of returns last quarter only improves the picture for credit. Leveraged loans, high yield and ABS delivered the most return for each unit of volatility or risk taken (Exhibit 2). Leveraged loans, for example, delivered 3.43% for each unit of volatility while high yield delivered 2.80%. Treasury debt delivered 0.67% for each unit of risk and MBS delivered 0.72%, the lowest return for risk taken, with other sectors in between.
Exhibit 2: Credit also posted the most return for each unit of risk taken
Source: Bloomberg, Santander US Capital Markets
Roughly the same picture comes through in excess returns, or returns after stripping out the impact of interest rates. High yield led the way with cumulative excess returns of 2.17% through the quarter with leveraged loans at 1.69%. At the other extreme, Treasury debt always delivers 0% excess return, based on the way the measure is calculated, and MBS delivered only 0.18%.
Relatively low correlation between returns on credit, rates
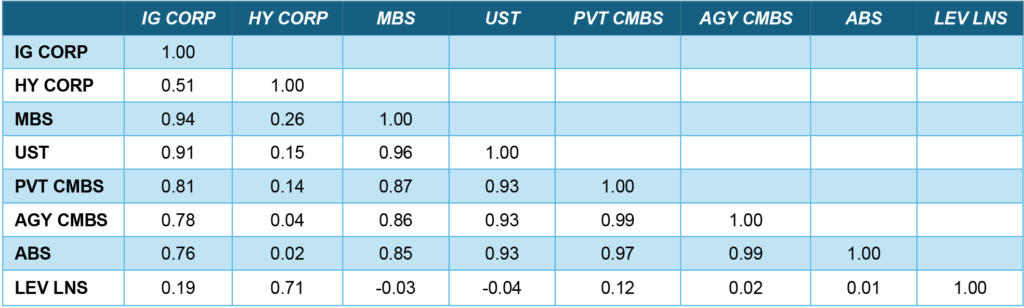
Deep credit also continued to stand out as a source of diversification. Sectors more sensitive to rates than credit—Treasury debt, investment grade corporate debt, MBS, private and agency CMBS and ABS—showed correlation of daily returns across sectors of between 0.81 and 0.94 (Exhibit 3). Sectors most sensitive to credit—high yield debt and leveraged loans—showed correlation with rates sector of 0.51 or lower, with floating-rate leveraged loans correlating at less than 0.20.
Exhibit 3: Rates sectors correlated at 0.81 or higher with each other
Source: Bloomberg, Santander US Capital Markets
Allocate to credit and MBS
Going forward, holders of credit and MBS risk may have something new on their side. The “Sell America” trade clearly in the market in April—rising US rates, tighter swap spreads, falling rates in other global markets, a weaker US dollar—has left a lingering impact. Swap spreads, for example, have still not recovered. And it seems likely after Liberation Day that the US role as global safe haven has a few new dents in it. It is early, but the risk of under-allocating to Treasury debt has likely diminished, improving the prospects of better relative returns to risk assets.
Credit clearly has momentum coming out of the second quarter, and it usually pays to let your winners run. Credit does look fundamentally rich, but rich things can get richer. The liquidity of MBS is nevertheless appealing ahead of the August 1 White House deadline for tariff agreements with a dozen or so trade partners and ahead of the impact of tariffs on inflation and growth showing up in the economic numbers. The deadline may get kicked down the road again, but the impact of current tariffs looks likely to land in the reports covering July and August. That could hurt credit. And that’s when the liquidity of MBS would allow rotating into credit at wider spreads. In the meantime, MBS stands to deliver returns in excess of Treasury debt. Portfolios should continue to lower allocation to Treasury debt and add to allocations in credit and MBS.
* * *
The view in rates
The market traded on Friday pricing fed funds at 3.82% to end the year, only 5.5 bp below the Fed’s June dots. The strong employment report for June has given the Fed some room to wait. And the Fed looks prepared to wait until it has a better view of whether tariffs will bring a 1-time price change or more persistent inflation. Presumably, any inflation impact from tariffs should start to play out in July and August. The market seems to believe the inflation impact will be muted or temporary or both, and fed funds lower by the end of the year as a result.
A new round of US tariff threats, including threats to Brazil for its prosecution of former President Jair Bolsonaro, has edged longer Treasury rates marginally higher relative to the swap curve. Debt-to-GDP is at 100% and expected to grow over the next decade to 124% after passage of the One Big Beautiful Bill Act. It all promises to add term premium to the yield curve, steepening the curve.
Other key market levels:
- Fed RRP balances settled recently at $183 billion, down from $461 billion on June 30. RRP balances now show a regular spike at the end of each quarter as banks reduce balance sheet and push repo volume to the RRP.
- Setting on 3-month term SOFR closed Friday at 432 bp, up 2 bp in the last two weeks.
- Further out the curve, the 2-year note traded Friday at 3.89%, up 15 bp in the last two weeks. The 10-year note traded at 4.42%, up 14 bp in the last two weeks.
- The Treasury yield curve traded Friday with 2s10s at 52 bp, flatter by 2 bp in the last two weeks. The 5s30s traded Friday at 97 bp, flatter by 4 bp over the same period
- Breakeven 10-year inflation traded Friday at 238 bp, up 8 bp in the last two weeks. The 10-year real rate finished the week at 202 bp, up 5 bp in the last two weeks.
The view in spreads
The market has absorbed the Israel-Iran conflict, the One Big Beautiful Bill Act and a new round of tariff threats surprisingly well, implying that broad risk to the global economy is nevertheless limited. That seems to give a lot of weight to the extension of the tariff negotiating deadline to August 1. The targeted counterparties look either likely to come to some temporary broad agreement or extend discussion into another deferral. That helps risk assets continue to hold their ground. The Bloomberg US investment grade corporate bond index OAS traded on Friday at 80 bp, tighter by 6 bp in the last two weeks. Nominal par 30-year MBS spreads to the blend of 5- and 10-year Treasury yields traded Friday at 146 bp, tighter by 1 bp in the last two weeks. Par 30-year MBS TOAS closed Friday at 34 bp, wider by 5 bp in the last two week.
The view in credit
A wide range of specific industries and individual companies still have exposure to tariff risk, but fundamentals for the average of the distribution continue to look stable. Most investment grade corporate and most consumer balance sheets have fixed-rate funding so falling rates have limited immediate effect. Consumer debt service coverage is roughly at 2019 levels. However, serious delinquencies in FHA mortgages and in credit cards held by consumers with the lowest credit scores have been accelerating. Consumers in the lowest tier of income look vulnerable, and renewed student payments and cuts to government programs should keep the pressure on. The balance sheets of smaller companies show signs of rising leverage and lower operating margins. Leveraged loans also are showing signs of stress, with the combination of payment defaults and liability management exercises, or LMEs, often pursued instead of bankruptcy, back to 2020 post-Covid peaks. If the Fed only eases slowly this year, fewer leveraged companies will be able to outrun interest rates, and signs of stress should increase. LMEs are very opaque transactions, so a material increase could make important parts of the leveraged loan market hard to evaluate.