


The Big Idea
Interpreting the recent rise in longer rates
Steven Abrahams | June 6, 2025
This material is a Marketing Communication and does not constitute Independent Investment Research.
The debate about higher rates at the long end of the US Treasury curve has made lots of noise lately about a likely federal budget with higher deficits and unwieldy supply. But the spread between Treasury and swap rates suggests supply is not really the culprit. Credit default swaps suggest it is something else, something messier and harder to correct.
Swap spreads—the difference between the swap and Treasury rate at the same maturity—should be the best place for getting a picture of the shifting balance of Treasury supply and demand. Rate fundamentals—growth, inflation, Fed policy and others—should affect the swap and Treasury curves equally, or, if you will, in parallel. But if expectations of Treasury supply suddenly rise or demand suddenly fall, then Treasury rates should rise relative to swaps and spreads should narrow or go negative. Longstanding efforts to model swap spreads (here and here, for example) say the same.
Since April, US Treasury rates have definitely moved higher relative to swaps, but almost all of it in the immediate aftermath of Liberation Day. Between Liberation Day and the 90-day pause, the difference between swap and Treasury rates on 2-, 5-, 10- and 30-year maturities tightened between 12 bp and 19 bp (Exhibit 1). Spreads widened immediately after the pause but have since stayed in a steady range. Spreads tightened again after Moody’s downgraded the US. The House then passed the latest budget on May 22—the one the Congressional Budget Office says will add $2.4 trillion to US deficits by 2034. But Treasury rates since then have actually narrowed to the swap curve across maturities, just the opposite result expected if supply concerns suddenly swamped the market.
Exhibit 1: Liberation Day seemed to trigger most of the tightening in US swaps
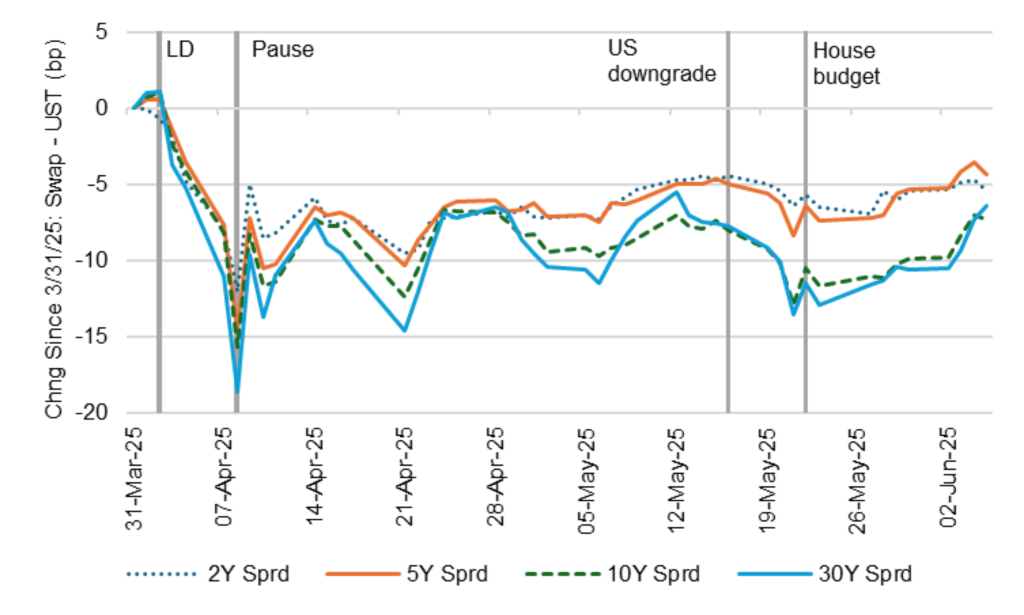
Source: Bloomberg, Santander US Capital Markets
Rates are complicated, and it is possible the drag on growth from tariffs announced on Liberation Day translated into concern about lower tax revenues and higher deficits. Presumably, the drag on growth and concern about supply would show up, too, in markets for the debt of countries that depend heavily on trade, such as Germany. But German swap spreads show no evidence of that (Exhibit 2). German swap spreads actually widened between Liberation Day and the pause—sovereign rates dropping faster than swap rates—suggesting less supply of German debt, more demand or both. With the US downgrade and the House budget, German spreads have seen another round of widening.
Exhibit 2: Liberation Day preceded wider swap spreads in Germany
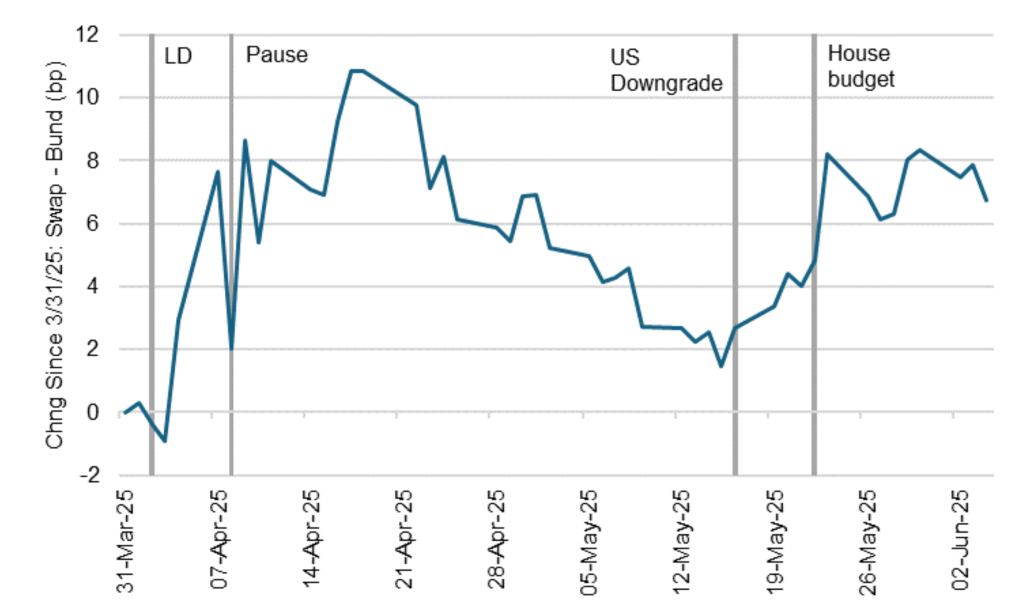
Source: Bloomberg, Santander US Capital Markets
One thing that has changed are premiums on sovereign credit default swaps. The premium for a US 5-year sovereign CDS moved up by 15 bp over the course of April and has declined by 5 bp since the House passed its budget. The premium on German 5Y CDS, in contrast, has declined nearly 3 bp since Liberation Day with Japan 5Y CDS up only 4 bp (Exhibit 3). The market in sovereign CDS can be spotty, so treat these changes cautiously. But providers of protection broadly want to get paid more to guarantee the par value of US debt.
Exhibit 3: US CDS premiums have jumped lately with German, Japan CDS flat
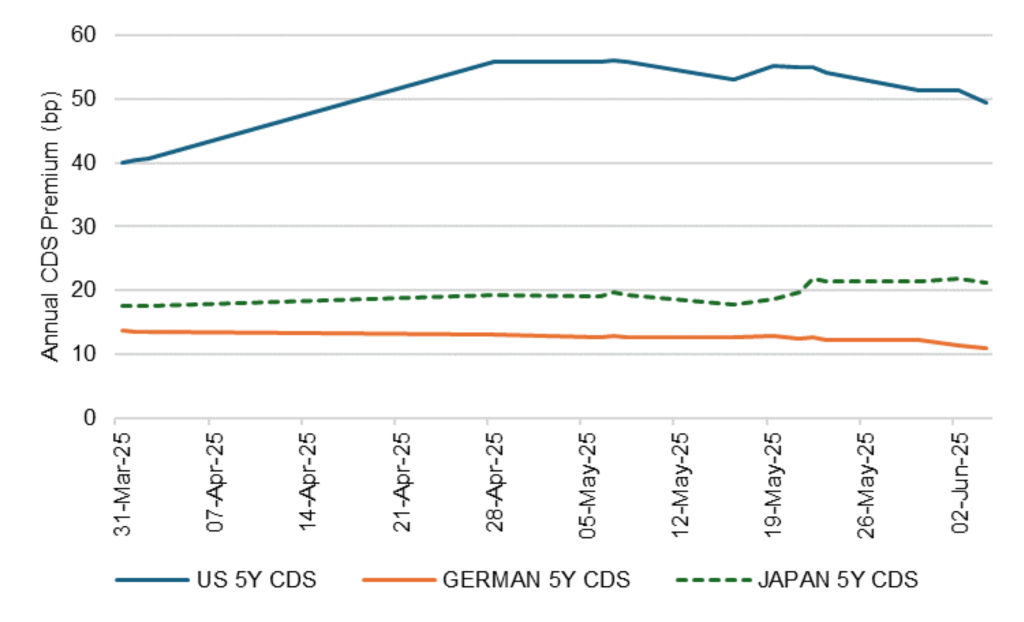
Source: Bloomberg, Santander US Capital Markets
These dots in the rates landscape suggest the rise in longer US rates, the higher term premiums are not narrowly about US debt supply but broadly about the stability of US policy. Liberation Day put in sharp relief the potential for sudden change in material US policy, anecdotally raising concerns about the US as a reliable safe harbor for investment capital. US spreads tightened again after the Moody’s downgrade reflected marginal concern about policy stability. Safe harbor status is on the radar at the Fed. These concerns may be heightened by the approaching US debt ceiling and its remote but non-zero risk of a missed debt payment.
If the recent rise in longer US rates only reflected concern about debt supply, then the Treasury could address the issue by shifting the debt mix or finding ways to encourage demand for longer maturities. While that might reduce longer term premiums on the margin, it seems Treasury will also need to persuade the debt markets that material US policy will be more stable and reliable than it has been lately. That is a messier problem to solve. Confidence is hard won and easily lost. The price is in the steeper yield curve.
* * *
The view in rates
The market closed on Friday pricing fed funds at 3.88% to end the year, exactly matching the Fed’s March dots. The close agreement reflects a series of messages from Fed speakers about the risk of inflation from tariffs. The Fed looks prepared to wait until it has a better view of whether tariffs will bring a 1-time price change or more persistent inflation
Moody’s downgrade of the US from ‘AAA’ to ‘Aa1’ on May 17 has almost certainly led more investors to focus on US fiscal policy and debt and the broader stability of other US policy. Debt-to-GDP is at 100% and expected to grow over the next decade to 117%. The CBO estimates the budget bill moving through Congress in its current form could add $2.4 trillion to the deficit by 2034. It all promises to add term premium to the yield curve, steepening the curve.
Other key market levels:
- Fed RRP balances dropped to $149 billion as of Friday, down $167 billion over the week. The drop reflects action since the end of May, when limits on bank willingness to do repo and balloon their end-of-month balance sheet pushed repo volume to the Fed facility. With banks opening up balance sheet, RRP balances drop.
- Setting on 3-month term SOFR closed Friday at 431 bp, down 1 bp in the last week.
- Further out the curve, the 2-year note traded Friday at 4.04%, up 16 bp in the last week. The 10-year note traded at 4.51%, up 12 bp in the last week.
- The Treasury yield curve traded Friday with 2s10s at 47 bp, flatter by 3 bp in the last week. The 5s30s traded Friday at 85 bp, flatter by 12 bp over the same period
- Breakeven 10-year inflation traded Friday at 232 bp, down 1 bp in the last week. The 10-year real rate finished the week at 218 bp, up 12 bp in the last week.
The view in spreads
The decision by China and the US to meet in London over the weekend and discuss trade has taken a bit more risk out of the market after a few weeks of battling over non-tariff barriers. Tariff risk nevertheless looks like a persistent new part of the market landscape. The next big turning point is likely to come in early July when we see what the US and its counterparties do at the end of the first 90-day pause. Steady signals that the US wants to keep making progress suggests the first pause will most likely roll into a second pause. The Bloomberg US investment grade corporate bond index OAS traded on Friday at 88 bp, tighter by 1 bp in the last week. Nominal par 30-year MBS spreads to the blend of 5- and 10-year Treasury yields traded Friday at 152 bp, tighter by 3 bp in the last week. Par 30-year MBS TOAS closed Friday at 37 bp, wider by 1 bp in the last week.
The view in credit
Tariffs should weaken most credits assuming slower growth, and hit specific credits hard based on exposure to cross-border trade flows. Excess returns from the first week of tariff war point to the specific sectors more or less exposed to tariff. We have been watching cracks in credit quality at the weaker end of the credit distribution for months. Fundamentals for the average of the distribution continue to look stable. Most investment grade corporate and most consumer balance sheets have fixed-rate funding so falling rates have limited immediate effect. Consumer debt service coverage is roughly at 2019 levels. However, serious delinquencies in FHA mortgages and in credit cards held by consumers with the lowest credit scores have been accelerating. Consumers in the lowest tier of income look vulnerable. The balance sheets of smaller companies show signs of rising leverage and lower operating margins. Leveraged loans also are showing signs of stress, with the combination of payment defaults and liability management exercises, or LMEs, often pursued instead of bankruptcy, back to 2020 post-Covid peaks. If the Fed only eases slowly this year, fewer leveraged companies will be able to outrun interest rates, and signs of stress should increase. LMEs are very opaque transactions, so a material increase could make important parts of the leveraged loan market hard to evaluate.