


By the Numbers
Playing fast with CLO debt as spreads widen
Steven Abrahams | March 21, 2025
This material is a Marketing Communication and does not constitute Independent Investment Research.
Spreads on ‘AAA’ CLO debt have widened roughly 15 bp to 20 bp since early February, leaving a healthy share of debt issued since September trading at or below par. That puts a fresh spotlight on the rate of CLO debt repayment. Debt trading below par that repays quickly delivers better returns and holds its value more than debt that repays slowly. Although repayment rates vary predictably with loan spreads over time, they also vary persistently across deals and managers. Investors should look for repayment rates to slow in the months ahead, but relative value to still favor today’s fast deals and fast managers.
Speed and relative value
CLOs debt starts paying down after the deal’s reinvestment period ends, repaid with principal from maturing loans and other sources. Other sources include principal from loan refinancing, amortization, recoveries after default or proceeds from loan sales. Since principal from maturing loans always goes to pay down debt, the other sources of principal are considered repayments. Debt pays down starting with the most senior class and ending with the most junior.
Repayments usually matter more for debt trading below par than for debt trading above. Discount securities repay principal at par, boosting security returns. Premium securities also repay at par, but the risk from loan and deal repayment usually is dwarfed by the risk of debt getting called by the deal manager. In the minority of cases where erosion of deal credit or other frictions prevent a premium deal from getting called, then rate of repayment can obviously matter. For securities on the cusp of going above or below par, attention to repayment rates matters for the ability of the security to hold value below par.
Repayment rates vary with loan spreads over time
Although the market usually estimates debt spreads assuming a constant 20 CPR in the CLO loan portfolio, actual loan repayment rates vary widely over time. Since the start of 2001, for instance, the Morningstar/LSTA loan index has repaid at a median monthly rate of 23 CPR with a quarter of monthly observations below 15 CPR and a quarter above 32 CPR (Exhibit 1).
Exhibit 1: Leveraged loan repayment rates have varied significantly over time
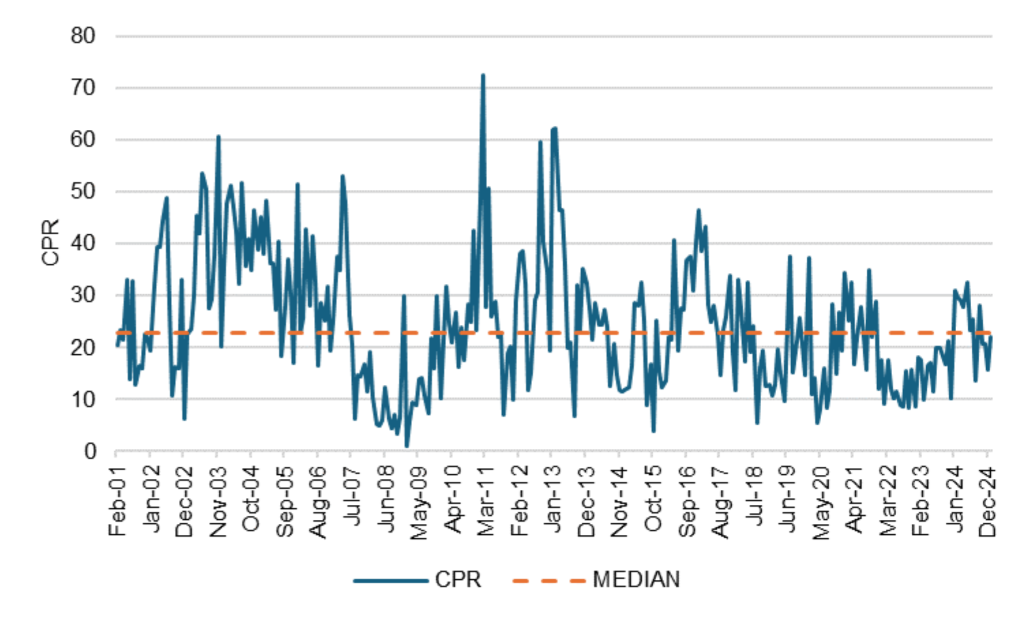
Source: PitchBook | LSTA US Institutional Loan Market Technicals, Santander US Capital Markets
Swings above and below the median have tended to last for months or even years. And although a mix of factors affect repayments, the biggest is the trend in loan spreads. When loan spreads trend down, older loans take advantage by refinancing and CPRs go up. When spreads trend up, refinancing goes away and CPRs go down. From 2001 through 2007, for instance, loan spreads trended down and CPRs ran consistently above the median (Exhibit 2). As the Global Financial Crisis unfolded from 2008 to early 2010, spreads widened sharply and then fell back to levels that still exceeded pre-crisis marks, depressing CPRs below the median. Since then, loan spreads have slowly trended lower with notable interruptions for the European sovereign debt crisis in 2011, the crash of the energy markets in 2016, the pandemic in 2020 and most recently the Fed’s tightening cycle. Loan spreads also started widening in February.
Exhibit 2: Loan spreads, the biggest influence on repayment, have varied, too

Source: PitchBook | LSTA US Leveraged Loan Index Discounted Spreads, Santander US Capital Markets
As spreads go—or more precisely, as refinancing incentives go—so goes repayment rates. With this year’s wider spreads, aggregate loan repayments should drift lower in the months ahead.
Repayment rates vary widely across deals and managers
Repayment rates on loans can feed repayment rates on CLO debt, but the pace on debt can vary significantly across deals whether overall loan speeds are fast or slow. For example, of the 389 BSL deals outstanding in the fourth quarter last year that had ended their reinvestment period and started returning principal to debt holders, the median debt repayment rate was 37 CPR with a quarter of deals below 25 CPR and a quarter above 50 CPR (Exhibit 3).
Exhibit 3: A wide distribution of repayments in late 2024 on post-RP BSL CLOs

Note: 389 post-RP deals with repayments in 4Q2024. Annualized by taking the quarterly rate and multiplying by four, which could allow a rate above 100 CPR.
Source: INTEX, Santander US Capital Markets
Differences in repayment rates across deals tend to persist. In other words, deals that repay slowly tend to continue repaying slowly from quarter to quarter, and deals that repay quickly tend to continue repaying quickly. This is clear in comparing post-RP deal repayment rates in the fourth quarter of 2024 to repayment rates in the third quarter (Exhibit 4). Slow deals tended to stay slow, the fast deals tended to stay fast.
Exhibit 4: Slow deals tend to stay slow, fast deals tend to stay fast
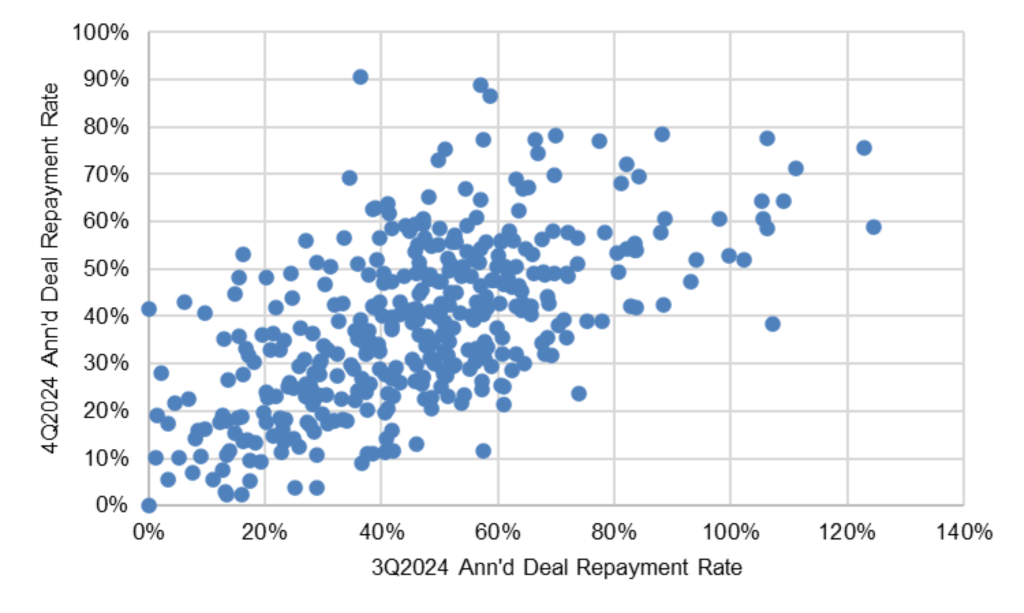
Note: 389 post-RP deals with repayments in each quarter. Annualized by taking the quarterly rate and multiplying by four. Annualization can produce rates above 100% if a deal repays more than 25% of its original debt balance in a quarter. Source: INTEX, Santander US Capital Markets
Speed of repayment also tends to persist across managers. This again is clear in comparing the rate of repayment by manager in the third and fourth quarters of last year (Exhibit 5). Managers that tended to repay debt in their deals slowly in the third quarter tended to stay slow in the fourth, and managers that tended to repay quickly in the third tended to repay quickly in the fourth.
Exhibit 5: Slow managers tend to stay slow, fast managers tended to stay fast

Note: Data show, for 82 managers, the simple average annualized repayment rate across each managers outstanding post-RP deals. Annualization can produce rates above 100% if a deal repays more than 25% of its original debt balance in a quarter.
Source: INTEX, Santander US Capital Markets.
In the final quarter of last year, the managers with the fastest rates of debt repayments included First Eagle, New York Life, Nassau, Goldentree and PineBridge (Exhibit 6). The managers with the slowest rates included King Street, CIFC, Angelo Gordon and Nuveen.
Exhibit 6: Managers* with the fastest, slowest repayment in 4Q2024

Note: *Analysis includes only managers with five or more deals post-RP in 4Q2024. Data show the simple average annualized repayment rate across each manager’s outstanding post-RP deals. Annualization can produce rates above 100% if a deal repays more than 25% of its original debt balance in a quarter.
Source: INTEX, Santander US Capital Markets.
Reasons repayments vary across deals and managers
While repayments on loans broadly depends on spreads, the flow of principal to deals can be more subtle. Because of the various sources of principal, the rate of repayments depends on both the loans and the rules governing the deal. At the loan level, the flow of principal depends on a few things:
- The maturity or weighted average life of the post-RP loan portfolio
- Opportunity for loans to refinance for a lower spread
- Incidence of amortizing loans
- Rates of default and recovery
- Trading volume
Principal repaid from loans maturing after the reinvestment period always gets passed through to pay down debt. But provisions for repaying debt from other sources of principal can vary from deal to deal. The provisions fall in a few broad categories:
- Full pass-through. In these deals, all loan principal received from refinancing, amortization, recoveries after default or proceeds from sale of loans gets fully passed through to debt holders. For hypothetical deals with identical loan portfolios, these deals would repay faster than deals with other provisions. Full pass-through provisions usually show up in deals of smaller managers trying to build an investor base.
- Constrained pass-through. In these deals, principal gets passed through to debt holders only if the deal fails to meet requirements for WARF, diversity, recovery, weighted average spread, weighted average life and ‘CCC’ exposure. If the deal satisfies these requirements, the manager can reinvest principal. The documents can require the manager to reinvest only in loans that exactly match the maturity and rating of the repaid principal, or that match based on weighted average maturity and ratings. These deals consequently are at risk of repaying slower than full pass-through deals.
- One-touch test. In these deals, the manager reports a snapshot of WARF, ‘CCC’ exposure and weighted average life at the end of the reinvestment period. If the deal falls short on any of these measures, it can make constrained pass-through of principal. If the deal passes on all marks, it can reinvest freely. And if it passes initially but fails on any marks later, it can still reinvest as long as portfolio metrics after reinvestment improve. These deals, on average, should repay faster than constrained pass-through deals.
- Limited pass-through. In these deals, there is no snapshot at the end of the reinvestment period and the manager can freely reinvest principal as long as portfolio metrics meet all quality requirements. And even if the portfolio falls short on any metrics at the end of the reinvestment period or afterwards, the manager can still reinvest as long as the portfolio metrics improve. This narrows return of principal to debt, and these deals should repay the slowest of all.
Across all deals, most documents still allow a manager to trade loans and reinvest proceeds if the manager expects the credit quality of the loan to materially erode. This could slow repayment across deals.
As a result, speed differences across deals reflect both differences in loan portfolio attributes—maturity schedule, refi and default risk—along with differences in manager trading frequency and differences in the deal provisions governing the pass-through of principal to debt holders. Since these aspects of a deal or manager tend to change slowly over time, it seems reasonable to expect relative speeds to change slowly. And that’s what the data show.
Looking ahead
All things considered, widening loan spreads should slow aggregate loan repayments in the months ahead. Index speeds have already dropped below the long-run 23 CPR median, and recently wider spreads should slow the pace further.
Speed differences across deals and across managers also stand to persist. In other words, even if aggregate speeds slow in the months ahead, slow deals should remain relatively slow and fast deals remain relatively fast. Similarly for managers, slow managers should remain relatively slow and fast managers fast.
Investors should look for deals and managers that recently have repaid debt relatively fast. If spreads widen further and those deals slip below par, they should hold their value better than alternatives repaying relatively slowly.