


By the Numbers
Trading the equity exposure of leveraged loans and CLOs
Steven Abrahams | May 3, 2024
This document is intended for institutional investors and is not subject to all of the independence and disclosure standards applicable to debt research reports prepared for retail investors. This material does not constitute research.
The value of CLO debt and equity depends heavily on the value of leveraged loans, and that value in turn depends on the likelihood the loans refinance or default. With some of the most valuable information about those risks shielded by private of borrower balance sheets, CLO investors need some other way to track risk. Public equity turns out to be a good bellwether. Tracking loan prices against public equity performance suggests CLO and loan investors own the downside of equities with little of the upside, and that loan prices only adjust slowly to the new information in the equity market. Investors may be able to take advantage of those relationships.
Equity downside without the upside
A snapshot of loan prices and equity performance shows the asymmetry of loan performance. Loan prices in aggregate hit a cap at par even in bullish markets for equity and drop sharply in bearish markets (Exhibit 1). From the start of 2011 through April 2024, for example, the S&P 500 rose 396% while the Morningstar/LSTA US Leveraged Loan Index price never exceeded $99.08. But in every bear market for equities since the start of 2011, loan prices dropped sharply. As pandemic shut down the US economy from March 2, 2020, to March 23,2020, for instance, the S&P 500 dropped 27.6% while the leveraged loan index dropped 19.7%.
Exhibit 1: Loan prices reflect the downside of equities with little of the upside
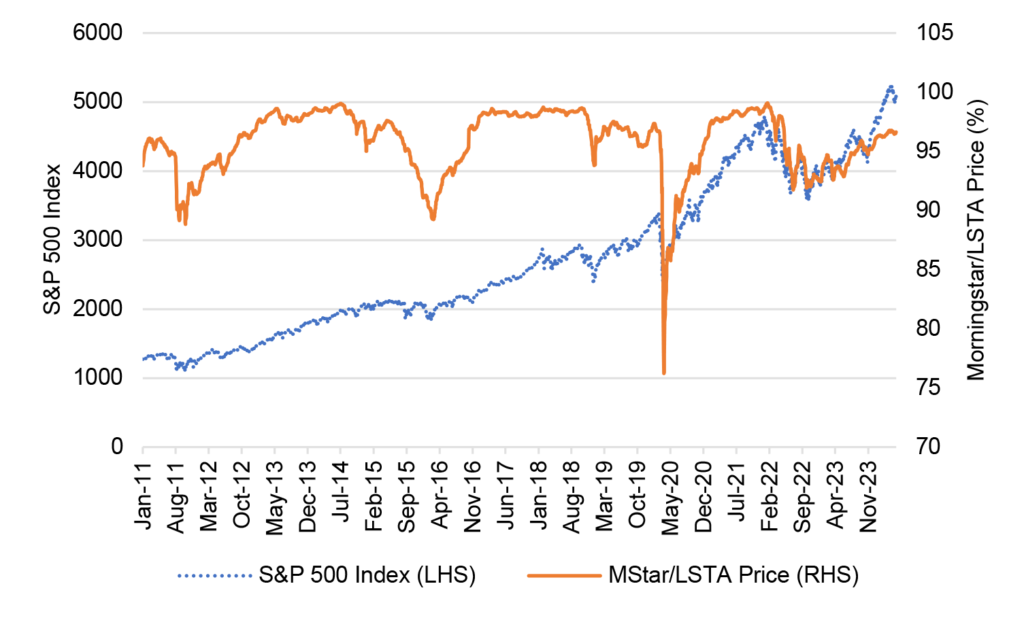
Note: Data show the Morningstar/LSTA US Leverage Loan Index price and the S&P 500 Index.
Source: Bloomberg, Santander US Capital Markets.
That asymmetry comes through, too, in a regression of daily percentage changes in loan prices on daily returns in the S&P 500. On days when the S&P rose 5%, for example, loan prices in the period studied went up on average by 0.16% (Exhibit 2). On days when the S&P dropped 5%, however, loan prices dropped on average by 0.70%.
Exhibit 2: A quick drop for loans on down days for equity, a slow rise on up days
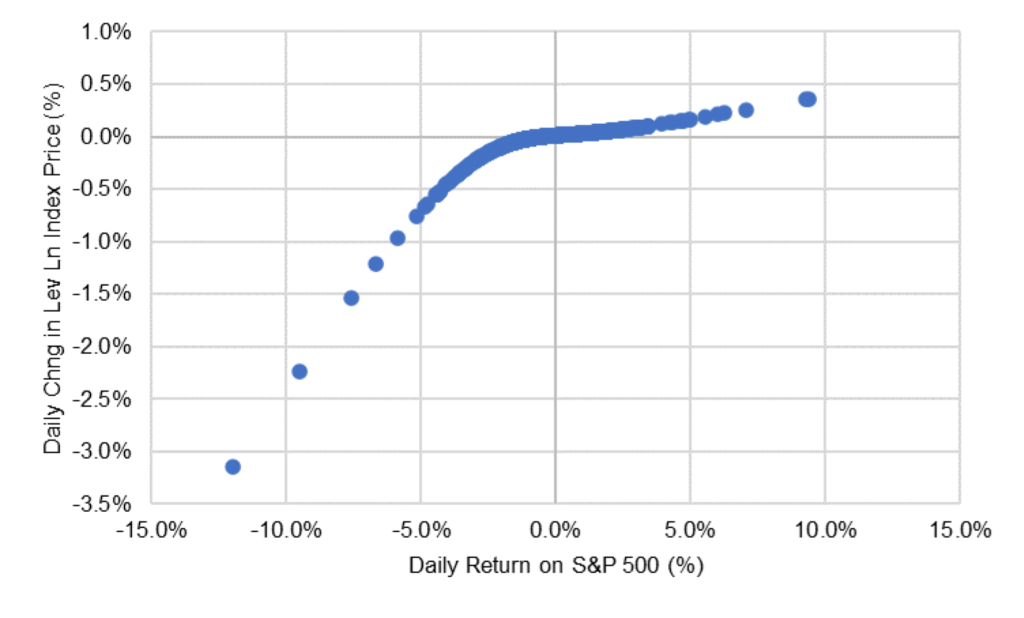
Note: Data shows the average percentage change in the Morningstar/LSTA US Leverage Loan Index price from 1/3/2011 to 4/30/2024 for the indicated daily total return on the S&P 500.
Source: Bloomberg, Santander US Capital Markets.
The asymmetry reflects both refinancing and default risk. In bull markets for equity, the market revises up its expectations for aggregate company earnings and credit quality, improving the likelihood that loan spreads will tighten and refinancings rise. No investors should pay above par for a loan immediately callable at that price. In bear markets, the market revises down its earnings and credit expectations, increasing the implied likelihood of default. Loan prices should drop to reflect expected recoveries.
Trading the asymmetry
This price profile for loans suggests investors in loans or CLO equity or junior debt are long a position in a par floating-rate security and short a put on equity, or, in this case, on the S&P 500. Each position—loans, CLO equity, CLO ‘BB’ debt or more senior classes—is short a different amount of put options. To a large extent, the discount margin or spread in the position reflects the implied premium from selling the put options.
It is intriguing to think about whether the loan or CLO markets sell those equity puts at the same price or for the same premium that the public equity markets do. It seems likely the prices for the puts differ across the markets. If the debt markets sell the puts at a rich price, that opens the possibility of buying loans or CLO equity or CLO junior debt, buying back the put options in the public markets and collecting the premium difference through better ongoing carry. Unfortunately, because investors cannot short-sell loans or CLO debt or equity in practice, the opposite trade isn’t available.
There’s more homework to do on these possibilities, including careful consideration of the impact of bid-ask in the different instruments.
Loan prices also reflect equity performance with a lag
Looking at daily percentage changes in loan prices and daily performance in equities also shows that loan prices reflect equity performance with a lag. A change in loan prices today, for example, reflects the change in equity prices today and for at least three prior days. Regressing daily changes in the Morningstar/LSTA index price on daily change in the S&P for the same day and three prior days shows all the S&P variables statistically significant at the 0.001 level. Changes in the S&P today and for three prior days explains 60% of the variance in daily loan prices.
If loan prices reflect the information in the S&P with a lag, then investors should be able to predict the change in loan prices today in part from the change in loan prices yesterday. And at least from early 2011 through April 2024, that is the case. Up days on loans tend to be followed by another up day, and down days tend to be followed by another down day (Exhibit 3). Of the 1,298 days observed in the study period where loan prices dropped, 64% were followed by a drop again the next day. And of the 1,679 days observed where loan prices rose, 70% were followed by a gain again the next day.
Exhibit 3: Down days for loan prices tend to follow down days, up days follow up
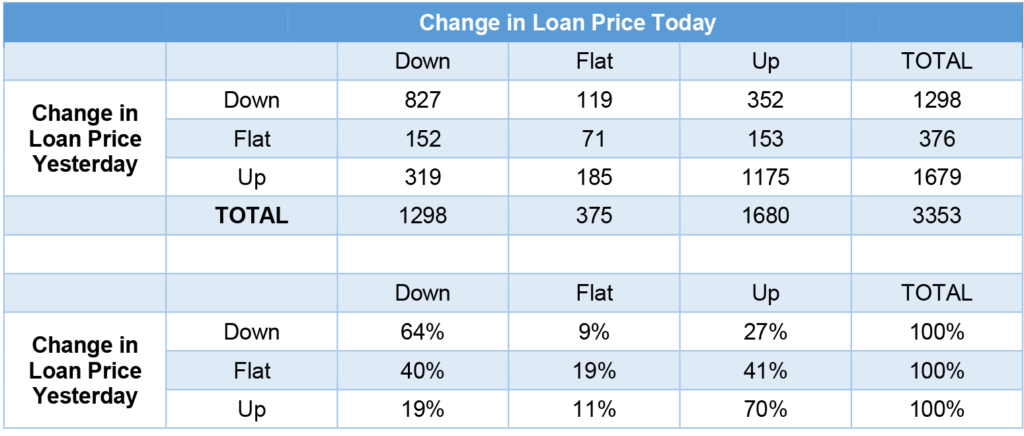
Note: Reflects daily percentage changes in the Morningstar/LSTA US Leveraged Loan Index price from 1/3/2011 through 4/30/2024.
Source: Bloomberg, Santander US Capital Markets.
The autocorrelation of loan prices with each other likely reflects the relative illiquidity of the leveraged loan market, at least compared to markets like the S&P 500. Only a portion of the leverage loan market actually trades every day while all or nearly all of the S&P 500 does. If loans only fully reprice once they actually trade, then the information available from the equity markets only gets built into loan prices over time, consistent with autocorrelation in daily loan price performance.
Trading the lag
Autocorrelation in aggregate loan prices raises the possibility of trading momentum, getting long loan exposure when prices tick up and getting short when prices tick down. An investor could do that in loans directly or in leveraged form in CLO equity or junior debt. The sensitivity of equity and junior debt to market value overcollateralization makes these leveraged exposures to loan prices. Of course, this approach, too, needs more homework, including consideration of bid-ask in the traded instruments.
Watching the equity signal
The equity markets clearly build in valuable information about the aggregate refinancing and default risk in the leveraged loan market, and the variety and liquidity of equity instruments open the possibility of trading debt against equity exposures or hedging debt with equity exposures. There’s plenty of opportunity for more work on these approaches.