


By the Numbers
Pricing, speed impact and modeling of second liens
Brian Landy, CFA | April 26, 2024
This material is a Marketing Communication and does not constitute Independent Investment Research.
Freddie Mac’s proposed second lien program potentially has broad impact across MBS. The agency may end up pricing these loans with much lower credit fees than non-agency second liens, giving borrowers inexpensive access to home equity but cannibalizing non-agency issuance. Pools backed by loans with low loan balances, low FICO or both will likely feel the biggest effect since those borrowers are much more likely to extract home equity. Unfortunately, most existing prepayment models do not seem to anticipate these speed differences across specified pool types.
Analysis of the proposed program, Freddie Mac’s existing pricing and likely borrower response to the proposed product points to a few key findings:
- Freddie Mac could charge low g-fees for second liens with at most 60% combined LTV
- The proposed program could have a very different impact across specified pools
- Low loan balance, low FICO and 100% investor pools should slow more and lose value when trading at a discount to par
- Florida, Texas, and generic pools should be less affected
- Yield Book’s prepayment model is not capturing cash-out differences across spec pool types.
Second liens could come with relatively low rates at lower combined LTVs.
The current loan-level price adjustments for cash-out refinance implies that the cost of a Freddie Mac second lien could be quite low for loans with low combined LTVs, but credit fees could be very high when combined LTVs exceed 70%. (Exhibit 1). The table shows the implied LLPA for a 10% second lien based on the borrower’s credit score and the current mark-to-market LTV of the first lien. Most borrowers with mark-to-market LTVs 50% or lower would pay a very low LLPA if Freddie Mac followed this system. That would likely lead to second lien note rates that are well below the typical rate charged for a second lien in the private market. On the other hand, the cost of borrowing over 60% LTV, especially when approaching 80% LTV, is extremely high. These borrowers would likely receive note rates comparable to or even higher than those offered in the private market.
Exhibit 1. Revenue-neutral implied LLPA for adding a 10% second lien.
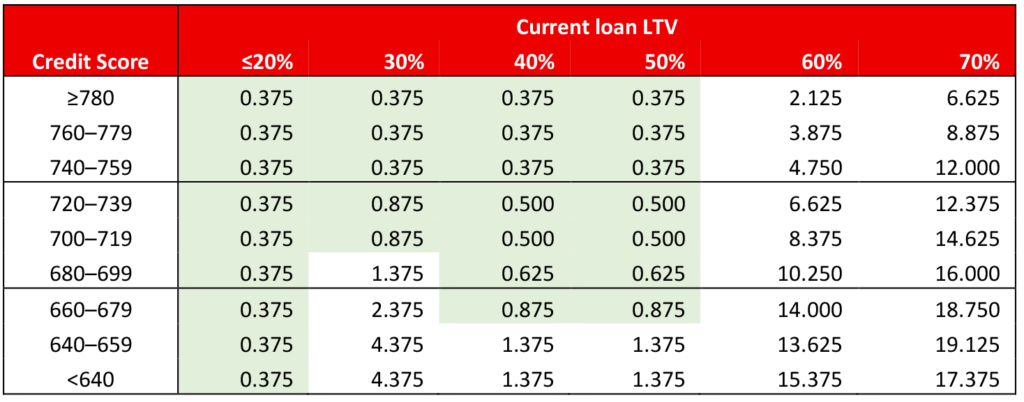
Note: Green cells have at most a 1-point implied LLPA for the second lien.
Source: Freddie Mac, Santander US Capital Markets.
These LLPAs are inferred from Freddie Mac’s current pricing for cash-out refinances. For example, consider a current Freddie Mac borrower, 740 FICO, that wants to borrow 80% against a house worth $150,000. The borrower could use an 80% cash-out refinance or a 70% first lien cash-out refinance and a 10% second lien. If Freddie Mac is indifferent between the two outcomes, then it should expect to receive the same total LLPA payment from either alternative. Freddie Mac’s pricing grid shows that the 80% cash-out would pay $2,850 in credit fees and the 70% cash-out would pay $1,050. The 10% LTV second lien needs to make up the $1,800 difference, implying a 12-point LLPA.
Of course, Freddie is not beholden to this approach, and could price second liens higher for some FICO and LTV combinations, and lower for others. For example, the green area indicates borrowers that would pay less than a 1-point LLPA under this cash-out neutral system. Maybe Freddie would want a flatter grid—charging more in the green areas and lowering costs for low FICO and high combined LTV loans. But it may find it difficult to stray too far from the pricing for cash-out refinances. And perhaps Freddie Mac will prefer to discourage borrowing at high combined LTVs. So, it seems likely that borrowers with low current LTV’s borrowing modest amounts of equity may receive a rate well below the current market rate for a second lien, possibly close to the typical rate for a first lien.
This might simplify trading and pricing second lien pools since there would be an actively produced and traded TBA contract with that coupon. The second lien pools will not be TBA deliverable but could be more easily hedged with the TBA and the investor would just face the pay-up risk. Hedging a 7% coupon second lien pool with the 7% TBA contract might be preferred to hedging a 10% coupon second lien pool with the 7% TBA contract. However, lending to a combined 80% LTV would create those harder-to-hedge higher coupon pools, further raising the cost of those loans to borrowers.
This implied LLPA matrix also suggests that high combined LTV loans could prepay very quickly with further appreciation. Consider a 740 FICO borrower with a 70% LTV first lien that borrows a 10% LTV second lien. That borrower would owe a 12-point LLPA, likely resulting in a high note rate. After a few years of 5% HPA the loan would drop to 60% LTV, and the borrower could presumably refinance the second lien using one with a 4.75-point LLPA. This loan could have a much lower note rate even If rates have not moved.
How Freddie sets the LLPAs is unlikely to tilt the economics in favor of cash-out refinances for loans currently priced well below par. However, it could make a difference for more recently originated loans that are priced at shallow discounts to par and have experienced some home price appreciation. Those borrowers might find a second lien more attractive than a cash-out refinance if Freddie sets LLPAs for higher combined LTVs well below the implied revenue-neutral levels.
Differences in impact across specified pools
Cash-out refinancing is currently most heavily used by borrowers with smaller loans and low credit scores (Exhibit 2). This table shows the cash-out refinance percentage of origination in each spec pool category, looking at production since the start of 2023. For example, 32% of the balance of new LLB pools, which contain loans no larger than $85,000, was cash-out refinances. That percentage steadily declines at larger loan sizes, falling to 6% for generic (non-specified) pools and only 4% for Florida and Texas pools. Low FICO and 100% investor pools have comparable cash-out usage to the Max $200,000 and Max $225,000 pool types.
Exhibit 2. Low loan balance, low FICO, and investment property borrowers are most likely to take out equity.
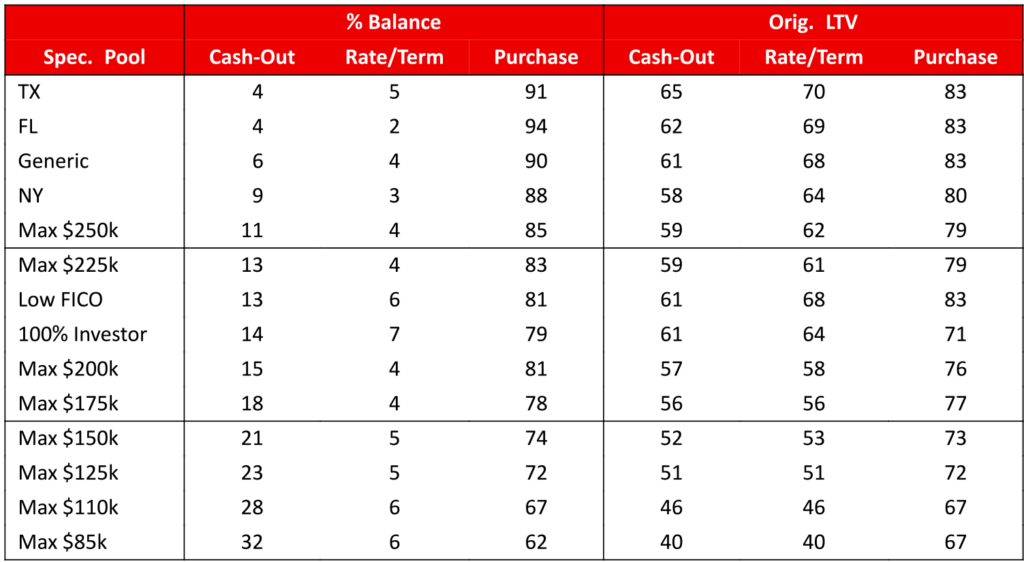
Note: Data for 30-year pools issued from January 2023 through March 2024.
Source: Fannie Mae, Freddie Mac, Santander US Capital Markets.
Borrowers with smaller homes are more likely to be younger or cash constrained and need to use a cash-out refinance. The same is true of borrowers with low FICO scores. And any borrowers that fit into both categories—small loans and low credit scores—are placed in low loan balance pools that carry a larger pay-up than a low FICO pool. It is commonly thought that borrowers regularly use a cash-out refinance to consolidate high interest rate credit card debt, since that might make the cash-out refinance sensible despite sacrificing a low note rate mortgage. However, some past studies indicate that most borrowers use the cash for home improvements or general consumption.
The average original LTVs for cash-out refinances are generally around 60%, give or take a few percent. The relatively low LTV also suggests that most borrowers are not pushing their LTVs back to 80%, which may be cost prohibitive due to the higher LLPA charged and the higher payment. The LTV drops even lower in the smallest loan size categories, as low as 40% for the cash-out refinances in LLB pools. That suggests that some of the cash-out loans in those pools may be coming from refinances of very seasoned loans.
There is just one category of low FICO specified pools, but loan-level data confirms that cash-out usage increases at lower credit scores (Exhibit 3). Only 5% of loans associated with credit scores over 775 were cash-out refinances, while 22% of loans originated to borrowers with credit scores between 650 and 674 were cash-out refinances. The cash-out original LTVs ranged from 54% to 61% and were highest in the belly of the FICO distribution. It could be that high FICO cash-out borrowers are more apt to minimize the amount borrowed to only what is necessary, and low FICO borrowers may not qualify for larger LTVs and the accompanying larger payment.
Exhibit 3. Cash-out issuance volume by FICO score.
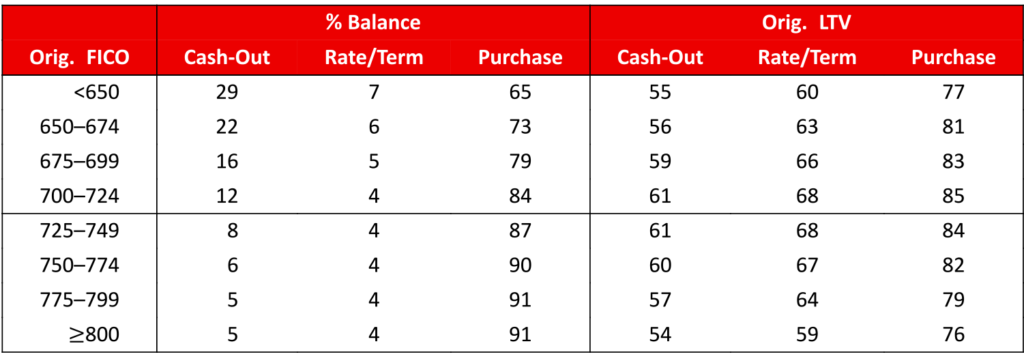
Data for loans in 30-year pools issued from January 2023 through March 2024.
Source: Fannie Mae, Freddie Mac, Santander US Capital Markets.
The cash-out origination volume data should have a strong connection to prepayment speeds on existing pools in those same categories because most cash-outs were linked to a refinance of a prior GSE-guaranteed loan. So a Florida cash-out refinance is linked to a Florida prepayment. A cash-out for an investment property must be linked to a prepayment of a prior loan for that investment property. Most equity gains come from home price appreciation, which means the balance of the loan paid off must be lower than the balance of the cash-out refinance. Therefore, loans in the various low loan balance pool types must have been tied to pay-offs of loans that were also small enough to be in low loan balance specified pools. So high cash-out production in a category implies there must have been high prepayments in that same category.
Models may not handle cash-out refinancings well
Yield Book’s prepayment model does not strongly differentiate between cash-out refinancings in different specified pool categories (Exhibit 4). Running the model across specified pools shows the projected effect on price, pay-up, and speeds if prepayments due to cash-out refinancing were to drop to 0 CPR. The price changes are similar across the pool types, including the TBA and the generic (non-specified pool) cohort. The price changes range from 5.3/32s lower for TBA to 8.9/32s lower for 2.5% 2021 generic pools. The pay-ups all decline between 0.8/32s to 3.5/32s. The speeds are also similar, with each cohort’s life speed slowing 0.2 CPR to 0.3 CPR. This seems inconsistent with the production data, which shows large volume differences across credit score and loan size buckets.
Exhibit 4. Valuation impact on 30-year 2.5% 2021 specified pools.
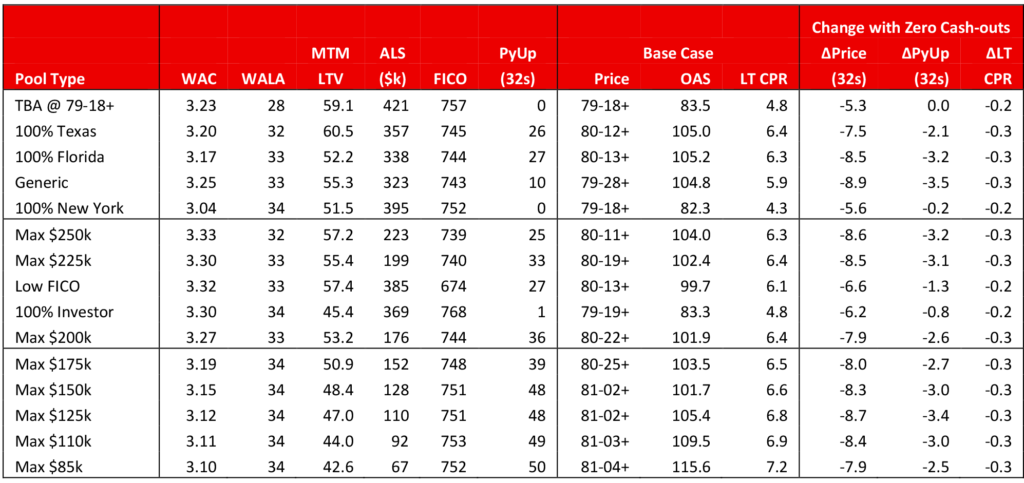
TBA price and pay-ups from Bloomberg BVAL. As of 4/24/2024. Rows sorted to match Exhibit 2.
Source: Yield Book, Santander US Capital Markets.
If the second lien program is approved and captures a lot of the cash-out activity, speeds could slow in ways not anticipated by Yield Book’s model. Discount low loan balance and low FICO pools may slow more than anticipated. Pools of Florida and Texas loans are more likely to maintain speeds and not lose value relative to the TBA. Pay-ups are typically lower on those two pool types than on low loan balance pools, so there is less pay-up risk to begin with. So investors concerned about the effect of this program that own low loan balance discount pools may want to consider shifting into Florida and Texas pools instead.
Finally, a drop in cash-out refinances is not the only avenue by which this program can affect speeds. Borrowers that take out seconds will have less lock-in, which could increase speeds for those borrowers when facing decisions about things like purchasing a new home. But the overall effect on a pool depends on how many would-be cash-outs are replaced with seconds, how many additional seconds are originated to borrowers that would not have used a cash-out refinance, and how many silent seconds are already being originated to some of these borrowers and held by banks or securitized in a private label deal. The ultimate effect on speeds depends on all of these factors, but pool types with the largest cash-out volume are likely to have speeds slow the most.