


The Big Idea
A dive into banks’ commercial real estate exposure
Tom O'Hara, CFA | February 23, 2024
This material is a Marketing Communication and does not constitute Independent Investment Research.
New York Community Bank’s recent turmoil has put a spotlight on commercial real estate and banks’ exposure to it. It is widely understood that banks with less than $100 billion in assets have greater exposure to multifamily and CRE loans than banks with more than $100 billion. But smaller banks nevertheless continue to report better credit performance in their portfolios, showing lower amounts of delinquent and non-accrual loans compared to their larger counterparts. And given the superior credit performance of smaller bank portfolios to date, their level of loss reserves—while smaller as a percentage of loans—are actually higher as percentage of delinquent and non-accrual loans.
Bank multifamily and commercial real estate loan exposure
Smaller banks have more exposure to MF and CRE loans on both a relative and absolute basis (Exhibit 1). As a percentage of total loans, small banks generally have 35% to 40% of their loan books allocated to MF and CRE, compared to only 10% to15% for larger banks.
Exhibit 1: Smaller banks have more multifamily and CRE as a share of loans
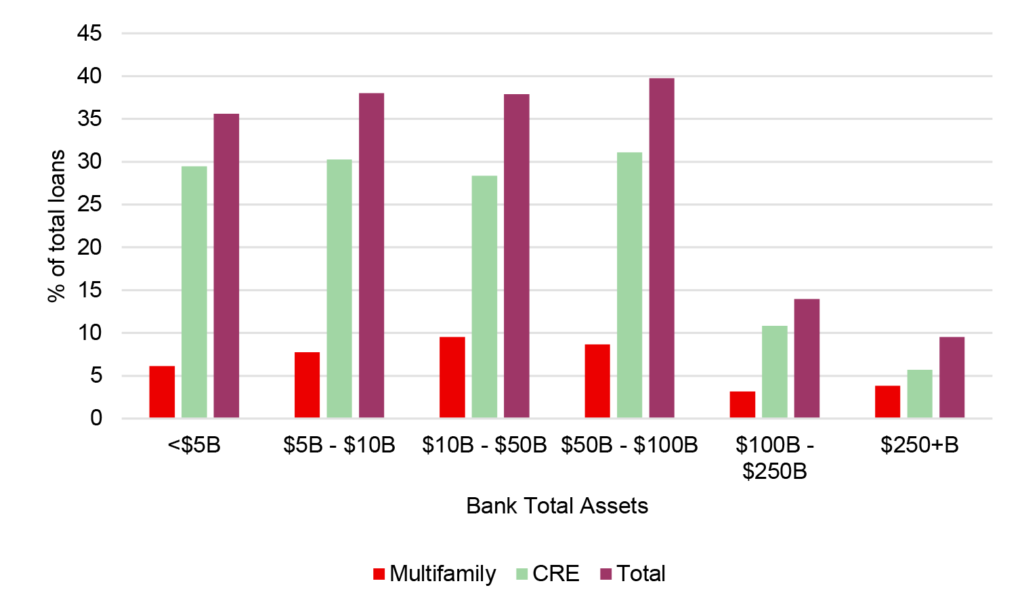
Note: bank regulatory filings lump all non-multifamily properties into one broad commercial real estate category. This analysis included over 200 banks of various sizes as of the fourth quarter of 2023, where the Y-9C regulatory data was available on S&P Global / Capital IQ as of mid-February 2024. Banks where the data was not yet available were excluded from the analysis.
Source: S&P Global / Capital IQ, Santander U.S. Capital Markets
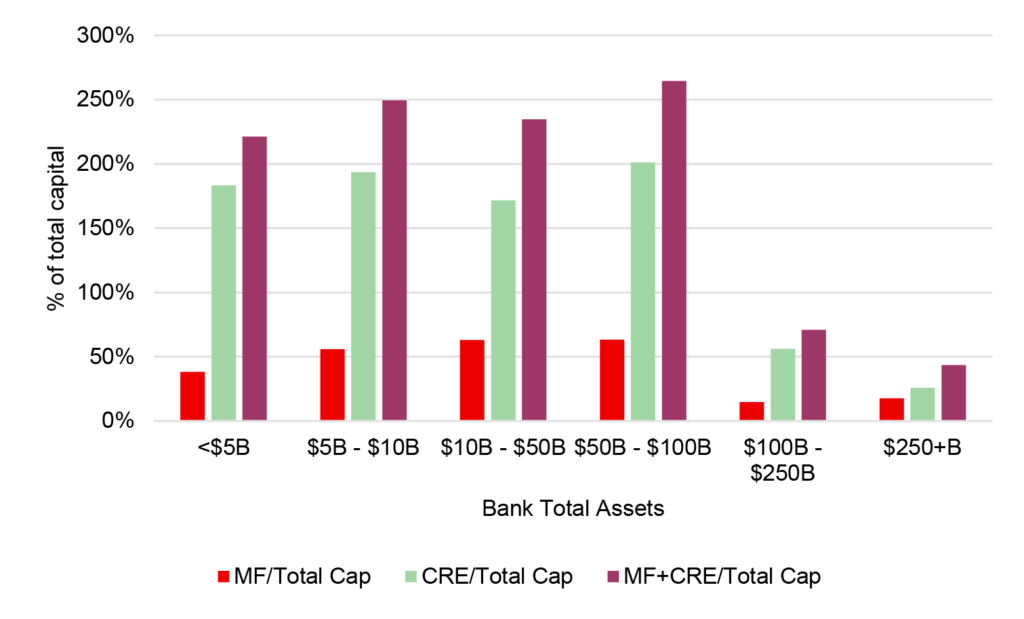
Smaller banks also have higher amounts of MF and CRE as a percentage of total capital (Exhibit 2). Banks are subject to additional regulatory scrutiny to the extent their MF and CRE exposure exceeds 300% of total capital. While the average for banks over $100 billion is assets is well below 100% of total capital, smaller banks generally average between 220% to 270% of total capital, with multiple individual banks exceeding the 300% threshold.
Exhibit 2: Smaller banks have more MF and CRE as a share of capital
Note: This analysis included over 200 banks of various sizes as of the fourth quarter of 2023, where the Y-9C regulatory data was available on S&P Global / Capital IQ as of mid-February 2024. Banks where the data was not yet available were excluded from the analysis.
Source: S&P Global / Capital IQ, Santander U.S. Capital Markets
Smaller banks show better MF and CRE loan credit performance
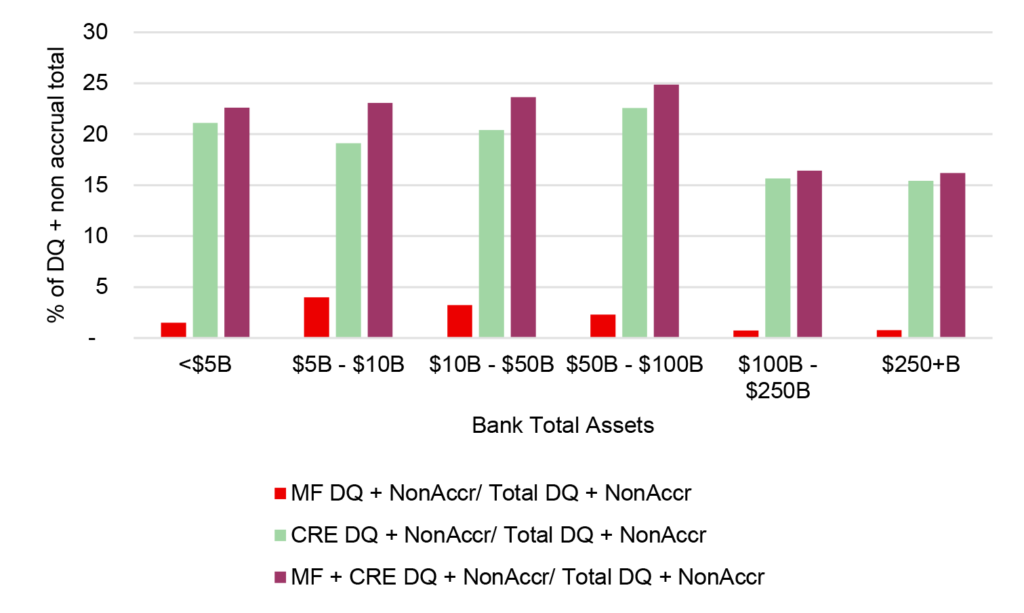
Looking at delinquent and non-accrual loans in a variety of ways shows smaller banks with better MF and CRE credit performance. Delinquent loans are those at least 30 days late in making a payment, and non-accrual loans are those that are at least 90 days late and not expected to pay principal or interest in full. For banks with assets below $100 billion, their delinquent and non-accrual MF and CRE is generally below 25% of total delinquent and non-accrual loans, smaller than their 35% to 40% MF and CRE loan allocation (Exhibit 3). Conversely, larger banks with assets greater than $100 billion have MF and CRE delinquent and non-accrual loans that are greater than 15% of total delinquent and non-accrual loans, higher than their loan portfolio allocation to these loan types.
Exhibit 3: MF and CRE delinquencies as a share of total delinquencies
Note: This analysis included over 200 banks of various sizes as of the fourth quarter of 2023, where the Y-9C regulatory data was available on S&P Global / Capital IQ as of mid-February 2024. Banks where the data was not yet available were excluded from the analysis.
Source: S&P Global / Capital IQ, Santander U.S. Capital Markets
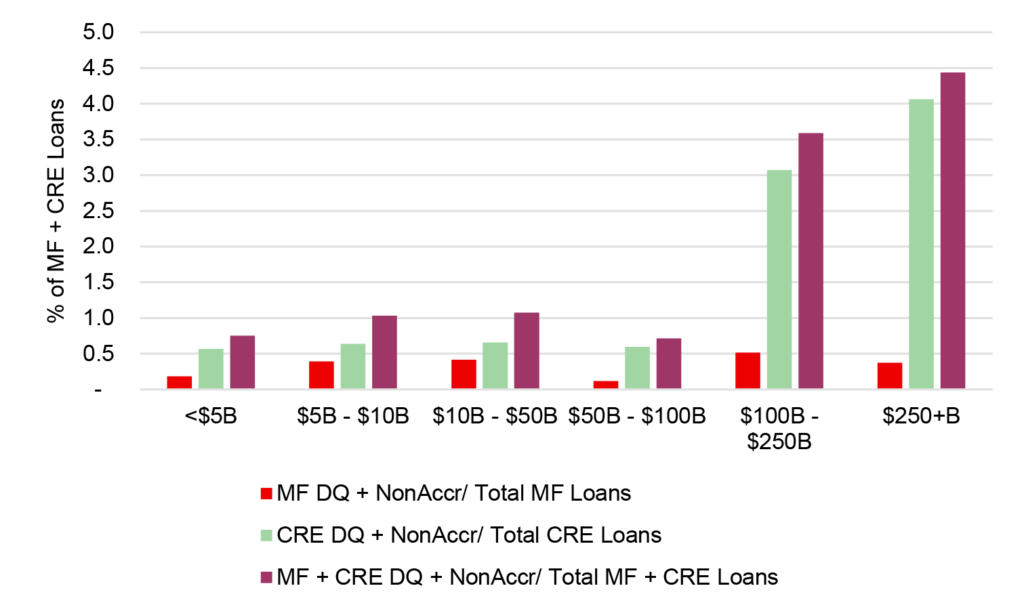
Another way to measure the credit performance of bank MF and CRE portfolios is to look at their delinquent and non-accrual loans in these categories as a percentage of their total MF and CRE loan books (Exhibit 4). Banks with assets below $100 billion generally have about 1% or less of their MF and CRE loan books in delinquent or non-accrual status, compared to 3.5%4.5% for banks with assets above $100 billion.
Exhibit 4: MF and CRE delinquency rates are lower at smaller banks
Note: This analysis included over 200 banks of various sizes as of the fourth quarter of 2023, where the Y-9C regulatory data was available on S&P Global / Capital IQ as of mid-February 2024. Banks where the data was not yet available were excluded from the analysis.
Source: S&P Global / Capital IQ, Santander U.S. Capital Markets
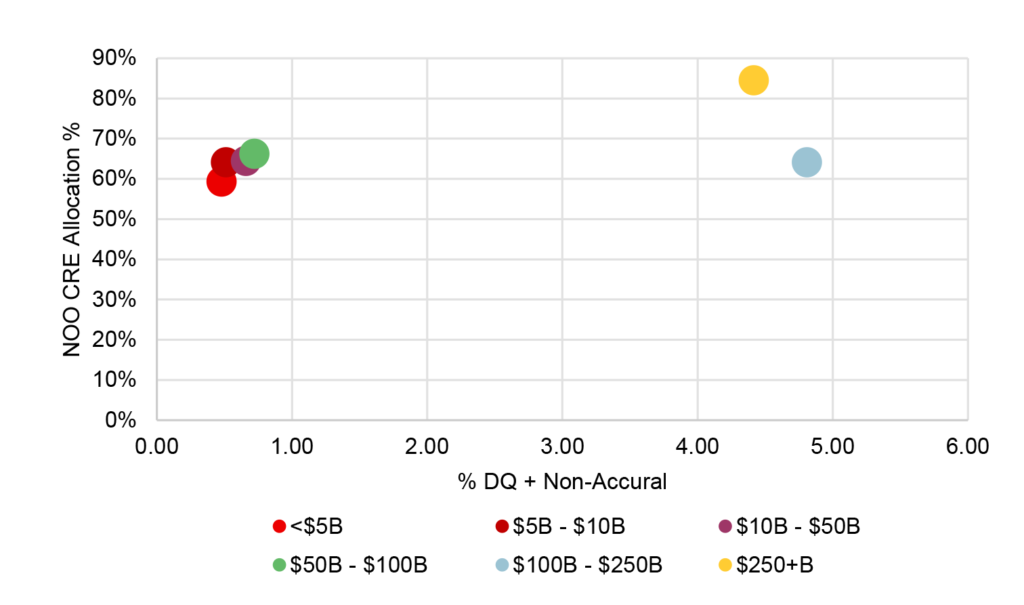
Another area where smaller banks appear to be outperforming is in their non owner-occupied (NOO) commercial real estate portfolios. While the very largest banks with assets greater than $250 billion have higher NOO CRE allocation of 85% of CRE on average, banks below $250 billion tend to consistently range from 60% to 65% NOO. There are several interesting and somewhat surprising observations in this area:
- One is that the NOO delinquency and non-accrual data tend to track that of the overall DQ data, which is that larger banks with assets greater than $100 billion are seeing delinquencies above 4%, whereas smaller banks have delinquencies below 1%.
- Also, while NOO properties such as some office have attracted negative headlines and their performance is worse for the larger banks, smaller banks with assets below $100 billion are generally seeing credit performance that is comparable with their owner-occupied loans.
- It also interesting to note that very small banks with assets below $10 billion are seeing better performance from their NOO loans compared to owner-occupied.(Exhibit 5A,5B).
Exhibit 5A: Owner-occupied CRE performance is similar at big, small banks
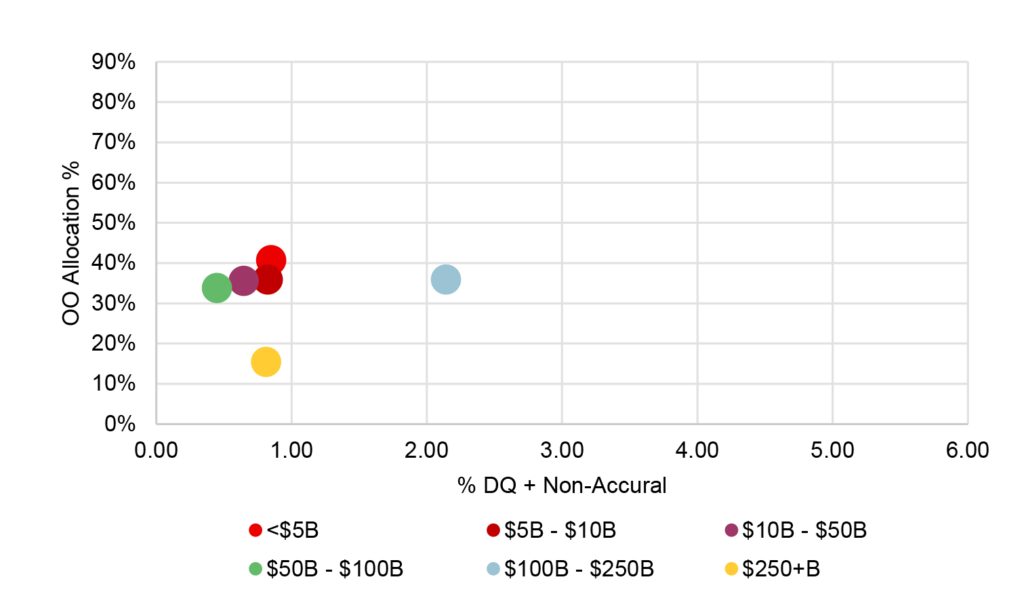
Exhibit 5B: Non-owner-occupied CRE performance is worse at big banks
Note: This analysis included over 200 banks of various sizes as of the fourth quarter of 2023, where the Y-9C regulatory data was available on S&P Global / Capital IQ as of mid-February 2024. Banks where the data was not yet available were excluded from the analysis.
Source: S&P Global / Capital IQ, Santander U.S. Capital Markets
Are smaller banks better underwriters of MF and CRE credit risk? Possibly, although it is important to note that smaller banks are not subject to the same degree of regulatory scrutiny as their larger bank counterparts. Some banks may be employing a ‘blend and extend’ strategy, where a lender will adjust the interest rate on a loan and also receive additional collateral in exchange for a short-term loan modification. It is possible that the better performance at smaller banks is somewhat due to a broader application of this strategy than that of larger banks.
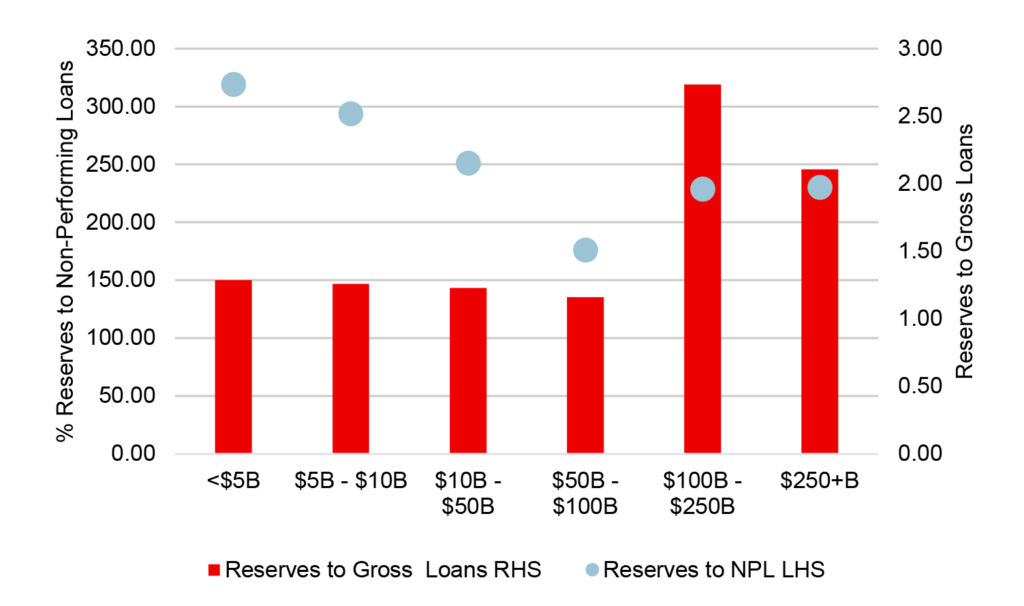
Smaller banks higher reserve levels relative to delinquent, non-accrual loans
At first glance, when looking at loss reserves relative to the size of the banks’ MF and CRE loan books, larger banks appear to be more well-prepared for stress with reserve levels in excess of 2% of their loan books. Smaller banks with assets below $100 billion only have 1.0% to 1.3% of their loan books reserved. However, with smaller bank portfolios experiencing fewer delinquent loans, their ratio of reserves to non-performing loans is generally superior to those of larger banks, the exception being banks with assets between $50 billion and $100 billion. Banks with assets greater than $100 billion generally have reserves that average 230% of their delinquent loans, whereas banks with assets below $50 billion have delinquent loan coverage of 250% to 320%. For now, the smaller banks appear to be properly reserved for the amount of stress they’re seeing in their portfolios (Exhibit 6).
Exhibit 6: Reserve adequacy
Note: This analysis included over 200 banks of various sizes as of the fourth quarter of 2023, where the Y-9C regulatory data was available on S&P Global / Capital IQ as of mid-February 2024. Banks where the data was not yet available were excluded from the analysis.
Source: S&P Global / Capital IQ, Santander U.S. Capital Markets
While smaller banks have larger MF and CRE exposure than larger banks when measured as a percentage of total loans or total capital, the smaller bank portfolios are currently outperforming the larger banks from a credit perspective when looking at a variety of metrics. Smaller bank MF and CRE delinquent and non-accrual loans comprise a smaller percentage of their total DQ and nonaccrual loans than their actual allocation to these loan types, and their percentage of DQ and nonaccrual MF and CRE loans is only about one-third of that for larger banks. Whereas non owner-occupied loans are presenting more problems for larger banks, smaller bank NOO portfolios are performing as well as or even better than their owner-occupied CRE loans. And smaller banks generally have reserve levels that are a higher multiple of current delinquent and non-accrual loans, positioning them well to absorb potential additional stress.