


By the Numbers
Manager excess returns trail the loan market through October
Caroline Chen | November 10, 2023
This document is intended for institutional investors and is not subject to all of the independence and disclosure standards applicable to debt research reports prepared for retail investors. This material does not constitute research.
CLO managers’ loan portfolio performance has trailed the broad market in most periods this year, and the latest reporting period was no exception. After adjusting for risk and reporting dates, even managers with low-risk loan portfolios underperformed through October. And the list of managers consistently beating the index lost a few names in the latest period, with a few managers trailing the index after delivering positive excess returns in the last four quarters.
Managers’ excess returns trailed the loan index by 12 bp through October
After accounting for CLO reporting dates, the Morningstar/LSTA leveraged loan index returned 2.85% for the three months ending in October. The average loan portfolio for managers with five or more actively tracked deals had a beta to the index of 1.02. With that beta, the average loan portfolio should have returned 2.91%, but managers instead posted a return weighted by AUM of 2.79%, trailing the index by 12 bp (Exhibit 1).
Exhibit 1: Managers lost to the index five times in a row

Note:
1) Each reporting period includes the most recent three months. For example, the reporting period ending in Oct-23 includes the average manager performance in the past three months ending on or before October 20, 2023.
2) The September reporting period data shows the average excess return relative to the Morningstar/LSTA total return index for 82 managers with five or more active deals. Deals managed by Gulf Stream are reported under Apollo.
Source: INTEX, Markit, Santander US Capital Markets LLC.
Out of the 82 managers tracked, only 24 outperformed the leveraged loan index, compared to 40 in the September reporting period, and 30 in the August reporting period. Individual managers’ excess returns to the index ranged from a high of 82 bp to a low of -49 bp through October.
Very few were able to keep the winning streak
The beta in the Santander US Capital Markets manager model, which measures managers’ historic loan portfolio risk profile, ranged from a high risk of 1.20 to a low risk of 0.88. High-beta managers, defined as those with a beta greater than or equal to 1.0, lagged the index by a weighted average 14 bp for three months through October. Additionally, risk-averse managers, those with a beta less than 1.0, also lost to the index by 6 bp (Exhibit 2). Risk-averse managers, on the other hand, posted positive excess returns in six out of the last 10 reporting periods, whereas high-beta managers only outperformed twice in the same periods.
Exhibit 2: Low beta managers had a lackluster performance through October

Note: Each reporting period includes the most recent three months. For example, the reporting period ending in Oct-23 includes the average manager performance in the past three months ending on or before October 20, 2023. The high beta group includes 53 managers whose beta is over or equal to 1 with a median of 1.04. The low beta group includes 29 managers whose beta is no more than 1 with a median of 0.97.
Source: INTEX, Markit, Santander US Capital Markets LLC.
Eight managers outperformed the index each quarter from the fourth quarter of 2022 through the third quarter of 2023, but only three were able to extend their strong performance into October. In addition, loan portfolios from Irradiant Partners and Fortress have shown improving performance trends, despite their loss to the index in the fourth quarter of 2022 (Exhibit 3).
Exhibit 3: Managers in the Spotlight

Note: Investcorp performance in 3Q 2023 included deals managed by Marble Point.
Source: INTEX, Markit, Santander US Capital Markets LLC
Less liquid loans may help to contribute to excess returns
In general, loan attributes have shown a weak correlation with managers’ excess returns. The correlation between bid depth and excess returns, however, was a negative 0.4, the highest in recent reporting periods, implying that less liquid loans may help in managers’ performance. The market price of less liquid loans may stay high when the broad market suffered spread widening in October. Managers who outperformed the index through October may have more illiquid loans in their portfolios than their peers (Exhibit 4).
Exhibit 4: Bid depth had a stronger correlation with excess returns

Note: Data shows the correlation of each measure, calculated across each manager’s outstanding deals, with excess return or alpha as measured for 82 managers through October 2023.
Source: INTEX, Markit, Santander US Capital Markets LLC.
The rankings
For the three months ending in October, Hayfin, Generate Advisors, Bardin Hill, Fortress, and Guggenheim led all managers with the highest excess return. A list of managers with five or more active deals and their excess returns is below (Exhibit 5). A complete list of managers and their returns is here.
Exhibit 5: CLO manager performance for the three months ending October
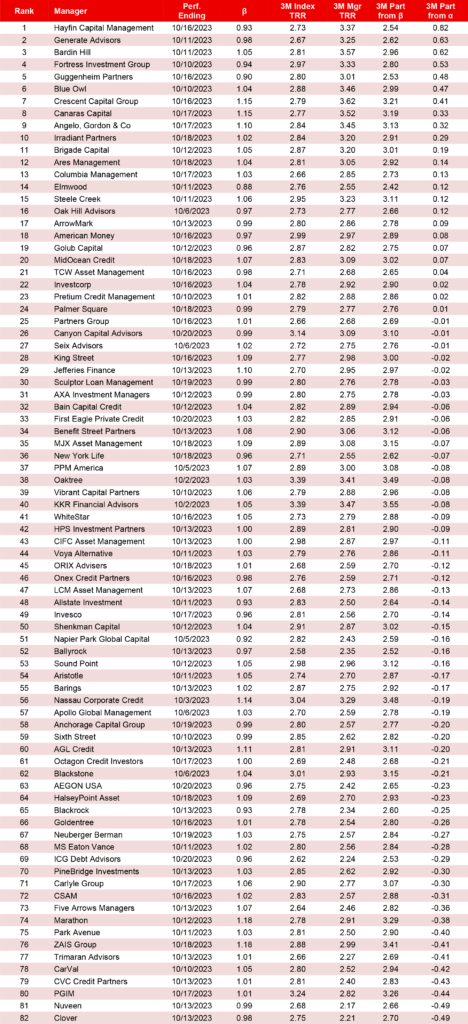
Note: Performance for managers with five or more deals issued since January 1, 2011, and tracked by SanCap. Performance attribution starts with calculated total return on the leveraged loan portfolio held in each CLO for the 3-month reporting period ending on the indicated date. CLOs, even with a single manager platform, may vary in reporting period. The analysis matches performance in each period to performance over the identical period in the Morningstar/LSTA Leveraged Loan Index. Where a deal has at least 18 months of performance history since pricing and no apparent errors in cash flow data, the analysis calculates a deal beta. The deal beta is multiplied by the index return to predict deal return attributable to broad market performance. Where no beta can be calculated, the analysis uses the average beta across manager deals weighted by the average deal principal balance over time. Any difference between performance attributes to beta and actual performance is attributed to manager alpha.
Source: INTEX, Markit, Santander US Capital Markets LLC
A link to SanCap’s latest CLO manager bubble chart (Exhibit 6) and to data on more than 120 managers and more than 1,000 active deals is here.
Exhibit 6: SanCap CLO manager bubble chart

Note: The size of each bubble reflects manager long-term beta.
Source: INTEX, Markit, Santander US Capital Markets LLC