


The Long and Short
Picks and pans according to percentile rank
Dan Bruzzo, CFA and Meredith Contente | September 22, 2023
This material is a Marketing Communication and does not constitute Independent Investment Research.
Banking trades wide, oil field services trade tight. Brokers and asset managers trade wide, restaurants trade tight. Media trades wide, basic industry trades tight. Some of those differences make sense based on fundamentals, supply, demand or all of the above. But somewhere in those differences also is relative value and an opportunity to rotate a portfolio up along that dimension.
Last week introduced a new framework for tracking current spreads against their 5-year historical performance. For each slice of the market—sector, subsector, ratings category, duration and so on—a current spread percentile rank shows where option-adjusted spreads for each sub-index compare over the last five years. After weighing fundamentals and technicals, it is straightforward to find individual bond ‘picks’ and ‘pans,’ where it appears the analytics are signaling securities that are potentially overvalued or undervalued. The selected bonds provide investors with an opportunity to make real portfolio decisions to take advantage of relative value highlighted through percentile rankings.
Exhibit 1: Investment grade sector spread percentile rank and OAS

Note: the blue bars represent percentile rank (LHS), the orange bars represent OAS (RHS).
Source: Bloomberg corporate bond indices, Santander US Capital Markets
Banking sector: percentile rank 74%
The first area of the market that jumps out of the results are the financial segments that dominate the ‘cheaper’ or ‘undervalued’ sectors on the percentile rank study (Exhibit 1). This is unsurprising given that the most notable credit sell-off in 2023 was centered around the regional banking crisis that struck in March. Though spreads across the broader market, and eventually in the banking sector, have gradually recovered, the banking segment is still among the most undervalued, and the basis for the first two ‘picks’ in this study.
Several weeks ago, single ‘A’ regional banks were highlighted as offering extraordinary value in the secondary market, with spreads trading well wide of their pre-crisis levels. While spreads in the sector have been gradually normalizing, this segment still appears to offer attractive risk compensation for investors with capacity to add exposure to the sector. Also, given the stark contrast in percentile ranks between long-dated maturities (overvalued) versus intermediate (undervalued), both picks in this segment are selected for bonds with intermediate maturities. Therefore, the picks listed below are the current 10-year maturity KeyCorp (KEY: Baa1/BBB/A-) bank notes and the M&T Bank (MTB: Baa1/BBB+/A) 5-year senior bank notes. Both banks exhibited strong fundamentals at the time of the recommendation and have continued to do so with recent earnings results.
Picks:
- KEY 5.0% 01/26/33 @ 257/10yr, G+255, 7.04%, $86.18 (bank level seniors – A3/BBB+/A-)
- MTB 4.7% 01/27/28 @ 208/5yr, G+200, 6.69%, $92.60 (bank level seniors – Baa1/A-/A-)
Exhibit 2. ‘A’ domestic regional banks intermediate debt maturities
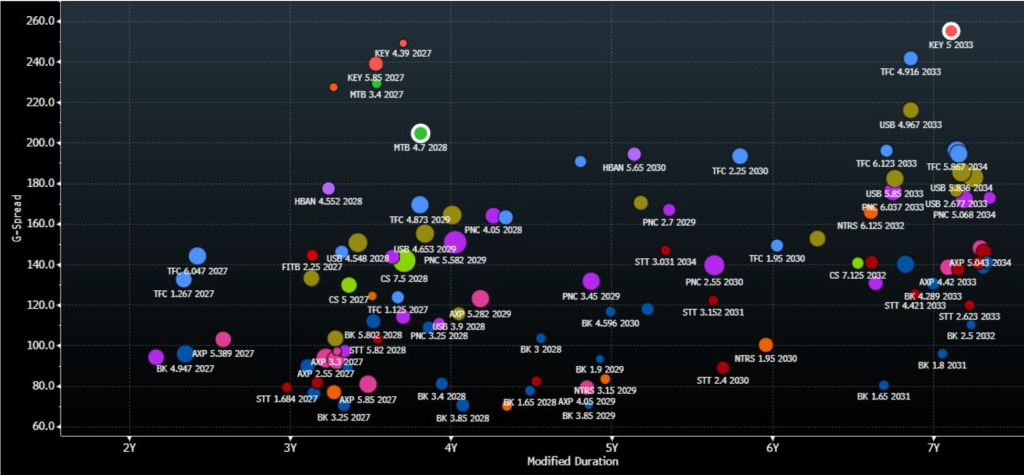
Source: Santander US Capital Markets, Bloomberg/TRACE BVAL G-spread indications
Brokers/Asset Managers/Exchanges: percentile rank 74%
Another area of the market that scored equally high to banking in percentile rankings at 74% was the broker/asset manager/exchanges segment, despite being relatively insulated from the key dynamics of the regional banking crisis. This sector of the market appears significantly undervalued on a 5-year historical basis, in contrast to what appears to be relatively stable overall fundamentals across the three main subgroups included in the sector. The picks in this sector include one of the more defensive selections in this study—the Intercontinental Exchange (ICE: A3/A-) senior 10-year notes—as well as one of the yield-ier selections among brokers—Jefferies Group (JEF: Baa2/BBB/BBB(pos)) 2032 senior notes. Both appear attractively valued at current spreads relative to the broader market, offering differing degrees of risk compensation.
Picks:
- JEF 2.75% 10/15/32 @ 178/10yr, G+175, 6.25%, $76.08 (Baa2/BBB/BBB(pos))
- ICE 4.6% 03/15/33 @ 109/10yr, G+107, 5.55%, $93.05 (A3/A-)
Exhibit 3. Brokers/Asset Managers/Exchanges – IG credits, intermediate maturities

Source: Santander US Capital Markets, Bloomberg/TRACE BVAL G-spread indications
Media Entertainment: percentile rank 61%
Warner Brothers Discovery (WBD – Baa3/BBB-/BBB-) spreads have widened more than its peer group after the company reduced full year EBITDA guidance for fiscal 2023, due to the ongoing WGA and SAG-AFTRA strikes. However, the company raised full year free cash flow guidance which is important as it remains in debt reduction mode. Excess free cash flow will be used to reduce debt and offset any decline in EBITDA. That said, management still believes that it will end the year with net leverage below 4.0x and gross leverage in the 2.5x-3.0x range by year-end 2024. Ratings should remain intact as they are largely predicated on management’s ability to hit its leverage targets. Given that WBD is unlikely to issue debt over the near term, the recent widening provides for an attractive entry point to add or enter the credit.
Picks:
- WBD 4.279% 03/15/32 @ 201/10yr, G+197, 6.49%, $85.77 (Baa3/BBB-/BBB-)
Cable Satellite: percentile rank 57%
Charter Communications (CHTR – Ba1/BBB-/BBB-) has explicitly stated its intent to keep leverage within the 4.0x-4.5x range as its secured Investment Grade ratings are important for access to capital. While most free cash flow will be directed to shareholders, management will scale back shareholder remuneration should it pursue an acquisition. Leverage is anticipated to decline a tick over the next year as EBITDA continues to grow. CHTR secured bonds trade considerably wide to Comcast Corp (CMCSA – A3/A-/A-) given the three-notch ratings differential. However, CHTR is only levered 3.2x through the secured bonds which is only an approximate half turn more than CMCSA’s gross leverage of 2.6x. Furthermore, CHTR’s EBITDA margin (38.8%) is 8 points higher than CMCSA’s (30.8%). CHTR 10-year bonds trade nearly 100 bp behind CMCSA, which is a sizeable pickup given the secured leverage differential and stronger EBITDA margins.
Picks:
- CHTR 4.4% 04/01/33 @ 195/10yr, G+194, 6.43%, $85.75 (Ba1/BBB-/BBB-)
Environmental: percentile rank 53%
Waste Connections Inc. (WCNCN – Baa1/BBB+/A-) continues to trade wide of its peers despite maintaining higher EBITDA margins and stronger free cash flow conversion. Leverage at WCNCN is in line with its peer Republic Services Inc. (RSG – Baa1/BBB+/A-) at 2.9x and roughly two ticks behind Waste Management Inc. (WM – Baa1 (p)/A-/A-). WCNCN has long maintained better margins relative to peers given its focus on exclusive municipal contracts and underserved secondary markets that tend to be insulated from competitors. While WCNCN has been acquisitive, completing twenty-four acquisitions in 2022 alone, it has largely maintained leverage below 3.0x. Management is expected to maintain prudent financial policies with leverage maintained in the 2.0x-3.0x range. WCNCN 10-year bonds trade roughly 15 bp behind both RSG and WM.
Exhibit 4. WCNCN Key Financial Metric Comparison

Source: Company Reports; Bloomberg; Santander
Picks:
- WCNCN 4.2% 01/15/33 @ 110/10yr, G+108, 5.57%, $90.12 (Baa1/BBB+/A-)
Basic Industry: percentile rank 35%
Although basic materials do not rank in the bottom five broad sectors by percentile rank, it still ranks well below the index average. Furthermore, the specific industry level metals & mining index at 26% ranks remarkably low (read: overvalued), particularly for such a cyclical segment of the IG market. Rio Tinto (RIOLN: A1/A), as one of the global leaders in iron ore production, remains heavily leveraged to China’s steel production and overall economic growth trajectory. In addition, the company is balancing growth ambitions, to further diversify away from its iron ore concentration, with its need to appease shareholders through repurchases/dividends, neither of which leaves much room for credit upside. At a minimum, current spreads, particularly on longer-dated paper, appear rich versus historical metrics.
Pans:
- RIOLN 5.2% 11/02/40 @ 97/20yr, G+105, 5.71%, $94.50 (A1/A/A)
Transportation: percentile rank 24%
The lowest scoring section for percentile ranks by sector is the transportation segment. Likely seeking refuge from the turbulence in the financial crisis, rate volatility and more cyclical segments of the industrial/consumer markets, investors have pushed transportation spreads to very tight historical levels. Furthermore, the availability of longer-dated maturities among transports has likely driven demand in recent weeks, causing the sector to be overbought versus the 5-year range of spread outcomes. Union Pacific (UNP: A3/A-A/-), despite being a highly stable credit in the sector, frequently issues debt in order to fund its shareholder renumeration programs, affording investors regular opportunities to re-establish position in the primary market from year-to-year. Given the demand for longer-dated paper, investors can reduce exposure to UNP 30-year notes and put resources to work in more rewarding areas of the market.
Pans:
- UNP 3.5% 02/14/53 @ 98/30yr, G+98, 5.53%, $70.66 (A3/A-/A-)
Restaurants: percentile rank 17%
While the subsector only contains three credits, the tightest trading credit remains McDonald’s (MCD – Baa1/BBB+). Despite price increases to offset inflationary pressures, MCD has maintained its value proposition and benefitted from any trade down from casual dining (particularly for households making 100 thousand or less). As such, comparable store growth has been in the low double-digit area so far this year. However, Darden Restaurants (Baa2/BBB) fiscal first quarter results suggest that casual dining is not witnessing the extent of customer trade down as previously anticipated. Comparable sales growth for the quarter was 5%, exceeding street estimates and lease adjusted leverage remains at the lower end of management’s 2.0x-2.5x target range (2.2x). This compares favorably to MCD’s lease adjusted leverage of 3.3x. While DRI maintains a much smaller capital structure than MCD, the yield pick-up between the credits is roughly 50 bp in the long end of the curve.
Pans:
- MCD 4.45% 03/01/47 @ 84/30yr, G+101, 5.69%, $84.05 (Baa1/BBB+)
Picks:
- DRI 4.55% 02/15/48 @ 164/30yr, G+154, 6.20%, $79.43 (Baa2/BBB)
Oil Field Services: percentile rank 10%
The Oil Field Services subsector witnessed stellar growth in fiscal 2022 and is poised to see mid-to-high teens top line growth in fiscal 2023. Furthermore, EBITDA and free cash flow growth has also been strong which has helped to improve balance sheets and credit metrics. As the tightest trading subsector, there might be little room for further upside, particularly in the tightest trading credit Schlumberger Limited (SLB – A2 (p)/A) relative to peers. Baker Hughes (BHI – A3/A-), provides for a 20bp g-spread pick up relative to SLB in 7-year part of the curve. BHI’s gross leverage is in line with SLB’s at 1.8x while its net leverage is nearly a half a turn lower than SLB (1.0x versus 1.4x), despite the one-notch lower ratings.
Pans:
SLB 2.65% 06/26/30 @ 77/10yr, G+67, 5.25%, $85.39 (A2 (p)/A)