


By the Numbers
A tour of 15-year MBS relative value
Brian Landy, CFA | September 15, 2023
This material is a Marketing Communication and does not constitute Independent Investment Research.
Option-adjusted spreads on MBS continue to trade near the widest levels since the financial crisis. The only time OASs have been wider was the onset of the Covid-19 pandemic. Spreads for 15-year MBS have widened more than 30-year MBS this year. And other metrics suggest that 15-year MBS may be trading wider than normal relative to corporate debt. Projected returns are higher on 15-year TBA than Walmart corporate debt, and 1-month carry remains positive even after hedging convexity with swaptions. Very seasoned 15-year pools look attractive compared to Treasury bonds, sporting higher returns with similar convexity.
OAS for 15-year MBS typically trade tighter than 30-year MBS (Exhibit 1). The top section plots the current coupon OAS from Yield Book for 30-year and 15-year MBS; the bottom section shows the OAS difference. The spread narrowed, and even inverted on occasion, after the pandemic. But it widened sharply in early 2022. Mortgage production slowed and net supply of 15-year MBS turned negative and has stayed negative throughout 2023. However, Silicon Valley Bank and Signature Bank owned a lot of 15-year pools, as well as 20-year pools that generally appeal to similar buyers. The FDIC sold those pools throughout the spring and summer, which pushed effective supply up and likely drove 15-year spreads wider.
Exhibit 1. Option-adjusted spreads for 15Y MBS are historically wide.
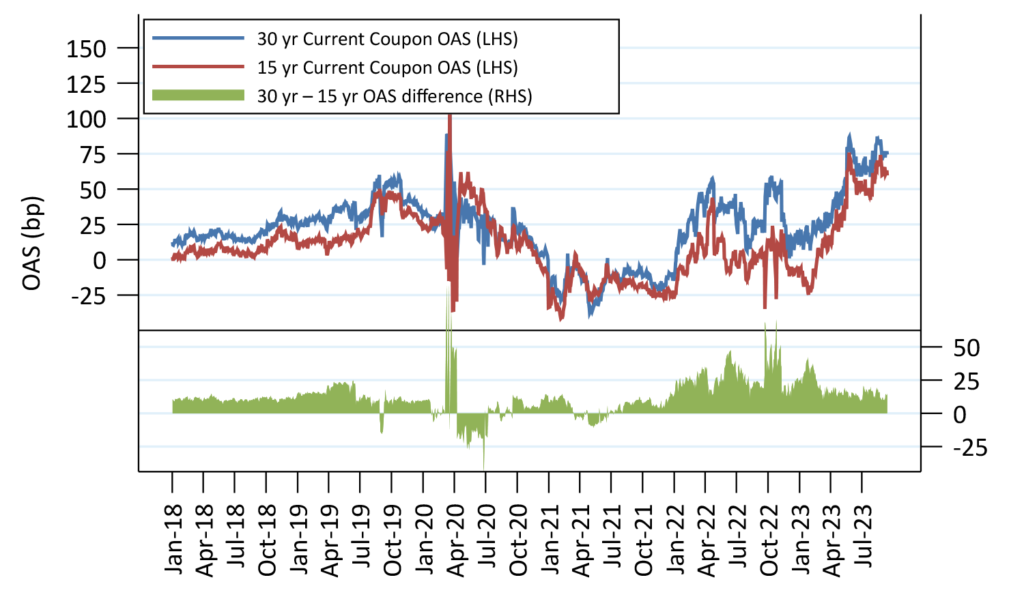
Source: Yield Book, Santander US Capital Markets
Other measures also suggest that 15-year MBS are trading wider than normal to 30-year MBS. Bloomberg’s model, BAM, has the 15-year current coupon OAS wider than the 30-year OAS. And the option-adjusted spread of the 15-year portion of Bloomberg’s MBS index is trading close to the widest level in 5-years (see this article for more details), and historically wider than 30-year MBS and corporate debt. The index uses the same model to calculate OAS but is weighted heavily towards lower coupons and not the current coupon.
15-year MBS compared to. corporate debt
The 15-year 3% TBA offers higher projected total returns over the next year than 5-year Walmart debt (Exhibit 2). These two bonds have similar duration and make a natural comparison. A portfolio of the Walmart debt and a small amount of 10-year Treasuries is constructed that has the same market value and duration as the 3% TBA. The mortgage-backed security generates 6 bp additional yield than the Walmart position and gives only 2 bp SOFR OAS. The Treasury OASs are nearly identical. One-year total returns are positive even if rates move 100 bp over the next year, and the MBS is projected to outperform if rates fall.
Exhibit 2. FNCI 3% vs 5Y corporate debt

Total returns in all assets assume a linear parallel shift in rates and constant OAS repricing at horizon, and reinvestment in 1-month SOFR. Returns do not account for dollar rolls. Calculations as of 9/13/2023.
Source: Yield Book, Santander US Capital Markets
A second comparison, using the 15-year 5% TBA and 3-year Walmart debt, paints a similar picture (Exhibit 2). The TBA has 42 bp higher yield than the Treasury debt and has wider OAS to SOFR and Treasury. The total returns are also positive across rate shifts and various steepener and flattener scenarios.
Exhibit 3. FNCI 5% vs 3Y corporate debt

Total returns in all assets assume a linear parallel shift in rates and constant OAS repricing at horizon, and reinvestment in 1-month SOFR. Returns do not account for dollar rolls. Calculations as of 9/13/2023.
Source: Yield Book, Santander US Capital Markets
Of course, a big risk of investing in mortgage-backed securities is negative convexity, and both the FNCI 3% and FNCI 5% have lower convexity than the corporate debt alternative. However, the total returns suggest that the base case return is high enough to compensate for the convexity risk. The returns also seem high enough to compensate for the possibility that the prepayment model could prove to be inaccurate.
The returns are high enough that carry over the next month is projected to be positive, even if rates move up to 50 bp (Exhibit 3). Both bonds are exposed to extension risk if rates move higher, but carry is projected to be positive even if rates increase 25 bp or fall up to 50 bp. The MBS positions perform well if the curve flattens but are projected to underperform if it steepens. The returns are high enough that investors worried about large rate moves could consider buying options as protection and possibly still earn a positive return if the options don’t recoup their premium.
Exhibit 4. Both positions are positive one-month carry

Total returns in all assets assume a linear parallel shift in rates and constant OAS repricing at horizon, and reinvestment in 1-month SOFR. Returns do not account for dollar rolls. Calculations as of 9/13/2023.
Source: Yield Book, Santander US Capital Markets
15-year MBS vs. 30-year MBS
Despite the wide spreads, 15-year MBS is still projected to underperform 30-year MBS over the next year (Exhibit 4). This table compares 15-year 2.5%s to 30-year 2.5%s. The portfolios are constructed such that the two MBS have the same market values. Then 10-year and 2-year Treasuries are added in equal amounts to match the durations. The 15-year mortgage-backed security earns 30 bp lower yield and gives 6 bp SOFR OAS to the 30-year MBS, and the total returns are lower across the board. On the positive side, it has greater convexity and lower spread duration, and it does outperform in a bull steepener.
Exhibit 5. FNCI 2.5% vs FNCL 2.5%

Total returns in all assets assume a linear parallel shift in rates and constant OAS repricing at horizon, and reinvestment in 1-month SOFR. Returns do not account for dollar rolls. Calculations as of 9/13/2023.
Source: Yield Book, Santander US Capital Markets
The comparison is a little more favorable up-in-coupon (Exhibit 6). This compares FNCI 5% to FNCL 5% with the same market values and using Treasuries to match duration. The 15-year MBS is still lower yield and has lower projected total returns than the 30-year MBS, but by a lesser amount than the 2.5%. And the 15-year 5% has a larger convexity advantage than the lower coupon.
Exhibit 6. FNCI 5.0% vs. FNCL 5.0%

Total returns in all assets assume a linear parallel shift in rates and constant OAS repricing at horizon, and reinvestment in 1-month SOFR. Returns do not account for dollar rolls. Calculations as of 9/13/2023.
Source: Yield Book, Santander US Capital Markets
Where the 15-year MBS outperforms is over a shorter horizon with more rapid rate moves (Exhibit 7). The base case carry is slightly negative for the 15-year pools, but if rates move 25 bp to 50 bp, the 15-year outperforms. This is particularly true of the 5% TBA, which has much higher convexity than the 5% 30-year TBA. The 5% outperforms in steepeners and flatteners, too, and only loses 0.1/32 if rates don’t budge.
Exhibit 7. One-month carry is better in the 15-year MBS

Total returns in all assets assume a linear parallel shift in rates and constant OAS repricing at horizon, and reinvestment in 1-month SOFR. Returns do not account for dollar rolls. Calculations as of 9/13/2023.
Source: Yield Book, Santander US Capital Markets
Seasoned 15-year vs. Treasuries
Finally, some older vintage 15-year pools have short time to maturity and a low enough coupon that they have positive convexity (Exhibit 8). This compares the cohort of 15-year 3% 2014 with somewhat lower loan sizes. Curtailments start to increase as 15-year pools approach maturity, usually with about 5 years remaining, and this cohort is 65 WAM. It is compared to a proceeds-neutral and duration-neutral combination of 2-year and 3-year Treasuries. The MBS is only slightly less convex than the Treasuries, and has higher projected yield, option-adjusted spread, and total returns than the Treasuries. The 15-year is projected to outperform over one-month as well, offering positive carry across 50 bp parallel interest rate moves, as well as most steepeners and flatteners (a bear steepener the modest exception).
Exhibit 8. Seasoned 15-year MBS vs Treasuries

Total returns in all assets assume a linear parallel shift in rates and constant OAS repricing at horizon, and reinvestment in 1-month SOFR. Returns do not account for dollar rolls. Calculations as of 9/13/2023.
Source: Yield Book, Santander US Capital Markets