The Long and Short
Still like Western Union
This material is a Marketing Communication and does not constitute Independent Investment Research.
Western Union (WU) bonds continue to trade at an attractive discount to similarly rated payment processing peers, following strong operating results and guidance through the second quarter of 2023. WU is indicated wide to all the names in the IG peer group in the short and intermediate part of the curve. Management has not tapped the public debt markets since 2021, and investors should not rule out a new issue to meet upcoming debt maturities. But a public launch could lend some price discovery to the issuer, as existing WU bonds tend to trade infrequently in sufficient size.
The Company reported second-quarter earnings earlier this week, with adjusted EPS of $0.51 coming in well ahead of the $0.39 consensus estimate. Top-line revenue was up nearly 3% year-over-year at $1.17 billion, which also topped the $1.05 billion consensus forecast for the quarter. Management raised full-year guidance for adjusted EPS to $1.65-to-$1.75 from $1.55-to-$1.65, which is now ahead of the $1.62 analysts’ consensus estimate. Much of the success in the second quarter was attributed to a sharp revenue increase in Iraq. Growth in customer-to-customer transactions was at the highest level since 2021.
The company’s closest peers include FI (Baa2/BBB) and FIS (Baa2/BBB) as well as the more direct digital competitors, including the lower-rated GPN (Baa3/BBB-) and higher-rated PYPL (A3/A-/A-). WU (Baa2/BBB) generally trades wide (Exhibit 1).
Exhibit 1. WU versus IG payment processor comps
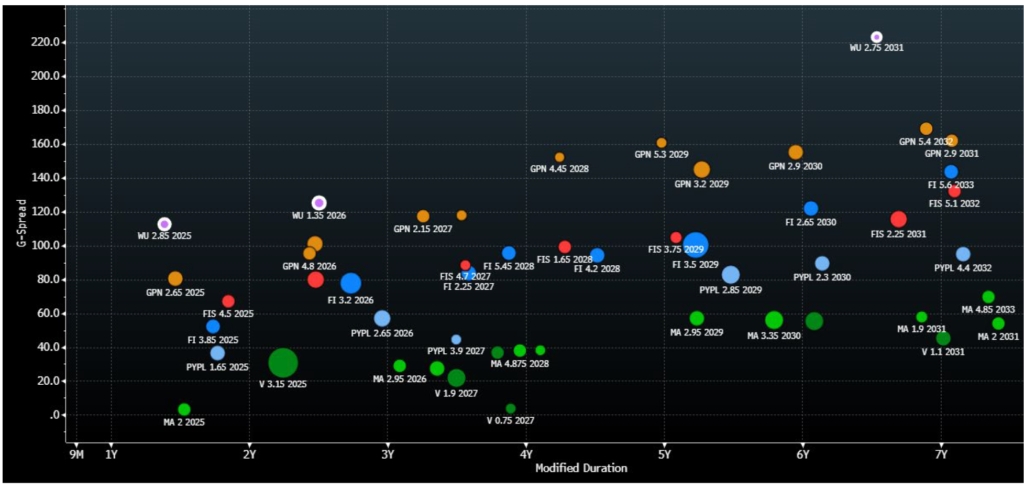
Source: SanCap, Bloomberg/TRACE BVAL indications only
The Issue: WU 1.35% 03/15/26 @ +125/3Y, G+112, 5.81%, $89.29
Issuer: Western Union Co (WU)
CUSIP: 959802AZ2
Amount Outstanding: $600 million
Ratings: Baa2/BBB
Global Deal
WU is a global leader in the cross-border payment market, operating through third party agents across its network of roughly 600,000 locations in over 200 countries. Around 90% of the company’s revenue is generated through consumer-to-consumer transaction. While digital transactions have made up a growing portion of the market over the past two decades, there remains, and likely will continue to remain, the need to send physical cash payments person-to-person, often cross border.
While WU’s business model has long been under pressure from technological advances of rival services and the ascension of digital competitors, such as PayPal or Venmo and Zelle, active migration patterns and global events continue to foster a need for this traditional service and have mitigated revenue erosion over the years. WU also continues to make inroads in advancing its own digital platforms, often through strategic partnerships. In short, WU’s customers’ reliance on extremely fast and reliable remittance service has proven far more resilient to competitive pressures than many have been predicting over the past two decades.
According to the most recent annual data from the World Bank, officially recorded remittance flows to low-and-middle income countries increased by over 5% in 2022 to roughly $626 billion, following a record recovery of over 10% in 2021. Western Union is estimated to have a roughly 17% market share in cash-to-cash and account-to-cash remittances worldwide.
WU operates with sustainably low leverage and consistent debt metrics. The company’s gross debt-to-EBITDA ratio has remained steadily in the 2-3x range since 2018 and was slightly elevated at 2.77x as of the second quarter, with a net debt-to-EBITDA ratio of just 1.21x. The company’s cash balance stands at just under $1.6 billion versus its total debt balance of $2.8 billion. EBITDA-to-interest expense coverage has also been in double digits for the past three years running.
Near-term debt maturity and liquidity needs remain highly manageable. WU already retired the $300mm that matured in the current year without tapping the debt markets. There is nothing due next year, and then $500mm in 2025 and $600mm in 2026. In addition to its sizable cash on balance sheet, WU has the entirety of its $1.46 billion revolving credit facility available if debt markets prove challenging over the near-term.
This material is intended only for institutional investors and does not carry all of the independence and disclosure standards of retail debt research reports. In the preparation of this material, the author may have consulted or otherwise discussed the matters referenced herein with one or more of SCM’s trading desks, any of which may have accumulated or otherwise taken a position, long or short, in any of the financial instruments discussed in or related to this material. Further, SCM may act as a market maker or principal dealer and may have proprietary interests that differ or conflict with the recipient hereof, in connection with any financial instrument discussed in or related to this material.
This message, including any attachments or links contained herein, is subject to important disclaimers, conditions, and disclosures regarding Electronic Communications, which you can find at https://portfolio-strategy.apsec.com/sancap-disclaimers-and-disclosures.
Important Disclaimers
Copyright © 2026 Santander US Capital Markets LLC and its affiliates (“SCM”). All rights reserved. SCM is a member of FINRA and SIPC. This material is intended for limited distribution to institutions only and is not publicly available. Any unauthorized use or disclosure is prohibited.
In making this material available, SCM (i) is not providing any advice to the recipient, including, without limitation, any advice as to investment, legal, accounting, tax and financial matters, (ii) is not acting as an advisor or fiduciary in respect of the recipient, (iii) is not making any predictions or projections and (iv) intends that any recipient to which SCM has provided this material is an “institutional investor” (as defined under applicable law and regulation, including FINRA Rule 4512 and that this material will not be disseminated, in whole or part, to any third party by the recipient.
The author of this material is an economist, desk strategist or trader. In the preparation of this material, the author may have consulted or otherwise discussed the matters referenced herein with one or more of SCM’s trading desks, any of which may have accumulated or otherwise taken a position, long or short, in any of the financial instruments discussed in or related to this material. Further, SCM or any of its affiliates may act as a market maker or principal dealer and may have proprietary interests that differ or conflict with the recipient hereof, in connection with any financial instrument discussed in or related to this material.
This material (i) has been prepared for information purposes only and does not constitute a solicitation or an offer to buy or sell any securities, related investments or other financial instruments, (ii) is neither research, a “research report” as commonly understood under the securities laws and regulations promulgated thereunder nor the product of a research department, (iii) or parts thereof may have been obtained from various sources, the reliability of which has not been verified and cannot be guaranteed by SCM, (iv) should not be reproduced or disclosed to any other person, without SCM’s prior consent and (v) is not intended for distribution in any jurisdiction in which its distribution would be prohibited.
In connection with this material, SCM (i) makes no representation or warranties as to the appropriateness or reliance for use in any transaction or as to the permissibility or legality of any financial instrument in any jurisdiction, (ii) believes the information in this material to be reliable, has not independently verified such information and makes no representation, express or implied, with regard to the accuracy or completeness of such information, (iii) accepts no responsibility or liability as to any reliance placed, or investment decision made, on the basis of such information by the recipient and (iv) does not undertake, and disclaims any duty to undertake, to update or to revise the information contained in this material.
Unless otherwise stated, the views, opinions, forecasts, valuations, or estimates contained in this material are those solely of the author, as of the date of publication of this material, and are subject to change without notice. The recipient of this material should make an independent evaluation of this information and make such other investigations as the recipient considers necessary (including obtaining independent financial advice), before transacting in any financial market or instrument discussed in or related to this material.
Important disclaimers for clients in the EU and UK
This publication has been prepared by Trading Desk Strategists within the Sales and Trading functions of Santander US Capital Markets LLC (“SanCap”), the US registered broker-dealer of Santander Corporate & Investment Banking. This communication is distributed in the EEA by Banco Santander S.A., a credit institution registered in Spain and authorised and regulated by the Bank of Spain and the CNMV. Any EEA recipient of this communication that would like to affect any transaction in any security or issuer discussed herein should do so with Banco Santander S.A. or any of its affiliates (together “Santander”). This communication has been distributed in the UK by Banco Santander, S.A.’s London branch, authorised by the Bank of Spain and subject to regulatory oversight on certain matters by the Financial Conduct Authority (FCA) and the Prudential Regulation Authority (PRA).
The publication is intended for exclusive use for Professional Clients and Eligible Counterparties as defined by MiFID II and is not intended for use by retail customers or for any persons or entities in any jurisdictions or country where such distribution or use would be contrary to local law or regulation.
This material is not a product of Santander´s Research Team and does not constitute independent investment research. This is a marketing communication and may contain ¨investment recommendations¨ as defined by the Market Abuse Regulation 596/2014 ("MAR"). This publication has not been prepared in accordance with legal requirements designed to promote the independence of research and is not subject to any prohibition on dealing ahead of the dissemination of investment research. The author, date and time of the production of this publication are as indicated herein.
This publication does not constitute investment advice and may not be relied upon to form an investment decision, nor should it be construed as any offer to sell or issue or invitation to purchase, acquire or subscribe for any instruments referred herein. The publication has been prepared in good faith and based on information Santander considers reliable as of the date of publication, but Santander does not guarantee or represent, express or implied, that such information is accurate or complete. All estimates, forecasts and opinions are current as at the date of this publication and are subject to change without notice. Unless otherwise indicated, Santander does not intend to update this publication. The views and commentary in this publication may not be objective or independent of the interests of the Trading and Sales functions of Santander, who may be active participants in the markets, investments or strategies referred to herein and/or may receive compensation from investment banking and non-investment banking services from entities mentioned herein. Santander may trade as principal, make a market or hold positions in instruments (or related derivatives) and/or hold financial interest in entities discussed herein. Santander may provide market commentary or trading strategies to other clients or engage in transactions which may differ from views expressed herein. Santander may have acted upon the contents of this publication prior to you having received it.
This publication is intended for the exclusive use of the recipient and must not be reproduced, redistributed or transmitted, in whole or in part, without Santander’s consent. The recipient agrees to keep confidential at all times information contained herein.


