By the Numbers
A few spots of value in specified pools
This material is a Marketing Communication and does not constitute Independent Investment Research.
MBS investor interest in specified pools has grown this year since TBA dollar rolls are no longer trading special. Heavy buying by the Fed and banks in 2020, 2021 and part of 2022 boosted dollar rolls. Investors able to roll positions could lift returns by buying TBA. But the Fed stopped buying MBS last year, and bank demand has stayed low, hurting rolls but making buying pools more attractive than they have been in a few years.
Starting with 30-year 2.0% pools: Texas and loan balance
Several types of 30-year with a 2% coupon have substantially wider option-adjusted spreads than the 2% TBA (Exhibit 1). The chart ranks cohorts of vintage and specified pool types from highest to lowest OAS using Bloomberg’s BAM prepayment model. Only cohorts with at least $10 billion outstanding balance outstanding were selected. Bloomberg includes these cohorts, and some smaller ones, in the MBS Index and prices them daily. At the top of the list are 2020 pools backed by 100% Texas collateral, which pick 31 bp OAS to TBA. The 2021 vintage Texas pools are also high on the list. Texas pools offer some prepay protection when in-the-money due to legal restrictions around cash-out refinancing at low loan ages; discount Texas pools have faster housing turnover from a stronger-than-average housing market over the last few years. The Texas pools are also available at low pay-ups to TBA; the pay-ups are printed to the left of each bar.
Exhibit 1. Conventional 30-year 2.0%s, Bloomberg OASs

Source: Bloomberg, Santander US Capital Markets
Some loan balance cohorts are available with similar OAS picks to TBA as those Texas cohorts. For example, 2020 and 2021 vintage pools of loans no larger than $175,000 and $200,000 rank just behind the highest OAS Texas cohort. These pools are available at higher pay-ups, however, ranging from 24/32s to 43.4/32s over TBA.
In 30-year 2.5% pools: Texas and loan balance redux
Low-loan balance cohorts lead the OAS pack in conventional 2.5%s (Exhibit 2). Pools from 2020 and 2021 with maximum loan sizes ranging from $150,000 to $250,000 pick anywhere from 13 bp to 28.1 bp OAS over TBA. These are also high pay-up options, with pay-ups as high as 36.6/32s. Low loan balance pools benefit from faster prepayment speeds from housing turnover, since these borrowers are more likely to need to trade into a larger home. That boosts the value of discount pools. And low loan-balance pools also offer significant prepayment protection if interest rates fall. Both factors contribute to a high price for these loans.
Exhibit 2. Conventional 30-year 2.5%s, Bloomberg OASs

Source: Bloomberg, Santander US Capital Markets
There are a couple low pay-up 2% cohorts that offer high option-adjusted spreads. The 2021 Texas pools pick nearly 21 bp OAS over TBA at only 3.4/32s pay-up. A couple other options are high LTV pools and low FICO pools, although the OAS picks are only around 12 bp.
In 30-year 3.0% pools: seasoning
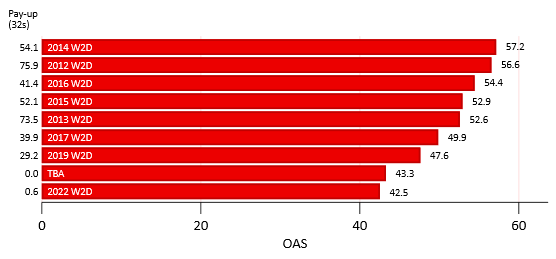
There are fewer options to choose from in the 30-year 3.0% coupon (Exhibit 3). Many of the typical specified pool types did not meet the $10 billion threshold for this analysis. But the worst-to-deliver (W2D) cohorts from a few older vintages offer 20 bp to 26 bp more OAS than the TBA. These cohorts benefit from seasoning, which typically lifts prepayments from housing turnover. And there is substantial burn-out in these cohorts since those borrowers did not refinance during the pandemic refinance wave. The pay-ups, however, are quite high and there are no low pay-up options that stand out.
Exhibit 3. Conventional 30-year 3.0%s, Bloomberg OASs

Source: Bloomberg, Santander US Capital Markets
In 30-year 3.5% pools: seasoning redux
The 3.5% coupon is like the 3% coupon, with only worst-to-deliver cohorts crossing the UPB threshold for inclusion (Exhibit 4). But the older vintages—2016 and older—pick 10 bp to 15 bp over TBA.
One caveat is that option-adjusted spread analysis depends on the prepayment model used; other models might take a different view of prepayments and value. And Bloomberg’s BVAL pricing isn’t always perfect, which can be seen by a couple cohorts that have negative pay-ups. However, the prices and model mostly seem reasonable, and provide a powerful and accessible tool for investors to screen for value in the MBS market.
Exhibit 4. Conventional 30-year 3.5%s, Bloomberg OASs
Source: Bloomberg, Santander US Capital Markets
This material is intended only for institutional investors and does not carry all of the independence and disclosure standards of retail debt research reports. In the preparation of this material, the author may have consulted or otherwise discussed the matters referenced herein with one or more of SCM’s trading desks, any of which may have accumulated or otherwise taken a position, long or short, in any of the financial instruments discussed in or related to this material. Further, SCM may act as a market maker or principal dealer and may have proprietary interests that differ or conflict with the recipient hereof, in connection with any financial instrument discussed in or related to this material.
This message, including any attachments or links contained herein, is subject to important disclaimers, conditions, and disclosures regarding Electronic Communications, which you can find at https://portfolio-strategy.apsec.com/sancap-disclaimers-and-disclosures.
Important Disclaimers
Copyright © 2026 Santander US Capital Markets LLC and its affiliates (“SCM”). All rights reserved. SCM is a member of FINRA and SIPC. This material is intended for limited distribution to institutions only and is not publicly available. Any unauthorized use or disclosure is prohibited.
In making this material available, SCM (i) is not providing any advice to the recipient, including, without limitation, any advice as to investment, legal, accounting, tax and financial matters, (ii) is not acting as an advisor or fiduciary in respect of the recipient, (iii) is not making any predictions or projections and (iv) intends that any recipient to which SCM has provided this material is an “institutional investor” (as defined under applicable law and regulation, including FINRA Rule 4512 and that this material will not be disseminated, in whole or part, to any third party by the recipient.
The author of this material is an economist, desk strategist or trader. In the preparation of this material, the author may have consulted or otherwise discussed the matters referenced herein with one or more of SCM’s trading desks, any of which may have accumulated or otherwise taken a position, long or short, in any of the financial instruments discussed in or related to this material. Further, SCM or any of its affiliates may act as a market maker or principal dealer and may have proprietary interests that differ or conflict with the recipient hereof, in connection with any financial instrument discussed in or related to this material.
This material (i) has been prepared for information purposes only and does not constitute a solicitation or an offer to buy or sell any securities, related investments or other financial instruments, (ii) is neither research, a “research report” as commonly understood under the securities laws and regulations promulgated thereunder nor the product of a research department, (iii) or parts thereof may have been obtained from various sources, the reliability of which has not been verified and cannot be guaranteed by SCM, (iv) should not be reproduced or disclosed to any other person, without SCM’s prior consent and (v) is not intended for distribution in any jurisdiction in which its distribution would be prohibited.
In connection with this material, SCM (i) makes no representation or warranties as to the appropriateness or reliance for use in any transaction or as to the permissibility or legality of any financial instrument in any jurisdiction, (ii) believes the information in this material to be reliable, has not independently verified such information and makes no representation, express or implied, with regard to the accuracy or completeness of such information, (iii) accepts no responsibility or liability as to any reliance placed, or investment decision made, on the basis of such information by the recipient and (iv) does not undertake, and disclaims any duty to undertake, to update or to revise the information contained in this material.
Unless otherwise stated, the views, opinions, forecasts, valuations, or estimates contained in this material are those solely of the author, as of the date of publication of this material, and are subject to change without notice. The recipient of this material should make an independent evaluation of this information and make such other investigations as the recipient considers necessary (including obtaining independent financial advice), before transacting in any financial market or instrument discussed in or related to this material.
Important disclaimers for clients in the EU and UK
This publication has been prepared by Trading Desk Strategists within the Sales and Trading functions of Santander US Capital Markets LLC (“SanCap”), the US registered broker-dealer of Santander Corporate & Investment Banking. This communication is distributed in the EEA by Banco Santander S.A., a credit institution registered in Spain and authorised and regulated by the Bank of Spain and the CNMV. Any EEA recipient of this communication that would like to affect any transaction in any security or issuer discussed herein should do so with Banco Santander S.A. or any of its affiliates (together “Santander”). This communication has been distributed in the UK by Banco Santander, S.A.’s London branch, authorised by the Bank of Spain and subject to regulatory oversight on certain matters by the Financial Conduct Authority (FCA) and the Prudential Regulation Authority (PRA).
The publication is intended for exclusive use for Professional Clients and Eligible Counterparties as defined by MiFID II and is not intended for use by retail customers or for any persons or entities in any jurisdictions or country where such distribution or use would be contrary to local law or regulation.
This material is not a product of Santander´s Research Team and does not constitute independent investment research. This is a marketing communication and may contain ¨investment recommendations¨ as defined by the Market Abuse Regulation 596/2014 ("MAR"). This publication has not been prepared in accordance with legal requirements designed to promote the independence of research and is not subject to any prohibition on dealing ahead of the dissemination of investment research. The author, date and time of the production of this publication are as indicated herein.
This publication does not constitute investment advice and may not be relied upon to form an investment decision, nor should it be construed as any offer to sell or issue or invitation to purchase, acquire or subscribe for any instruments referred herein. The publication has been prepared in good faith and based on information Santander considers reliable as of the date of publication, but Santander does not guarantee or represent, express or implied, that such information is accurate or complete. All estimates, forecasts and opinions are current as at the date of this publication and are subject to change without notice. Unless otherwise indicated, Santander does not intend to update this publication. The views and commentary in this publication may not be objective or independent of the interests of the Trading and Sales functions of Santander, who may be active participants in the markets, investments or strategies referred to herein and/or may receive compensation from investment banking and non-investment banking services from entities mentioned herein. Santander may trade as principal, make a market or hold positions in instruments (or related derivatives) and/or hold financial interest in entities discussed herein. Santander may provide market commentary or trading strategies to other clients or engage in transactions which may differ from views expressed herein. Santander may have acted upon the contents of this publication prior to you having received it.
This publication is intended for the exclusive use of the recipient and must not be reproduced, redistributed or transmitted, in whole or in part, without Santander’s consent. The recipient agrees to keep confidential at all times information contained herein.


