By the Numbers

Lower FHA MIPs have a muted effect on MBS value

| March 3, 2023

This document is intended for institutional investors and is not subject to all of the independence and disclosure standards applicable to debt research reports prepared for retail investors. This material does not constitute research.

The Federal Housing Administration is lowering mortgage insurance premiums for most borrowers, but high mortgage rates should limit the effect on the value of mortgage-backed securities. The average Ginnie Mae MBS should lose only 1.5/32s from this change, although higher coupon securities issued in 2022 and 2023 could lose more since they face more refinancing risk but account for a small percentage of outstanding Ginnie Mae pools. Ginnie Mae spreads have tightened relative to conventional spreads since the announcement, indicating that the market is comfortable with the change.

The average price of an outstanding Ginnie Mae MBS should drop by 1.5/32s or less due to lower mortgage insurance premiums (Exhibit 1). This result comes from calculating OAS on each coupon and then repricing each coupon at that OAS using a prepayment model that incorporates the lower premiums. The change has little effect on low coupons that are deeply out-of-the-money to refinance and even helps lift speeds on discount collateral now that borrowers face lower costs to buy a home. Lower MIPS have a bigger impact on higher coupons that face more refinancing risk. But those coupons represent a small portion of outstanding Ginnie Mae MBS. Bond durations are typically shorter because borrowers are expected to prepay more quickly.

Exhibit 1: Theoretical effect of lower FHA insurance premiums on TBA values.

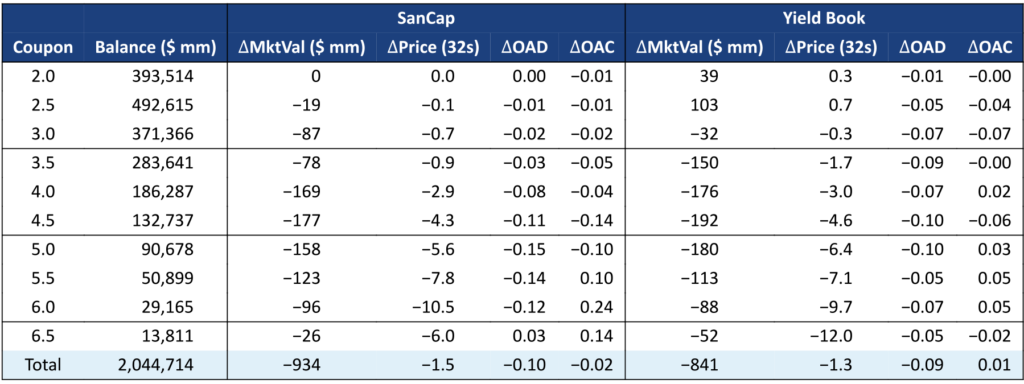
Source: Ginnie Mae, Yield Book, Santander US Capital Markets

The same analysis was run using Yield Book’s v22.2 model and the experimental version of that model that incorporates the MIP reduction. The results are broadly consistent with the Santander model, although Yield Book assigns a little more benefit to the elbow shift for deep discount pools. Yield Book projects that Ginnie Mae 2.0% and 2.5% TBA should add a little value because of the MIP reduction. Yield Book has a strong lock-in effect, which increases the importance of insurance premiums on borrowing costs.

The yield spread between Ginnie Mae and conventional 30-year current coupons has tightened since the announcement (Exhibit 2). The chart shows the Ginnie Mae current coupon minus the conventional current coupon, so lower numbers imply Ginnie Mae MBS have outperformed conventional MBS. The spread fell to -22 bp on March 1 from -13 bp on February 21, suggesting the market had already priced in the MIP reduction, although the spread is obviously influenced by other factors as well.

Exhibit 2: Ginnie Mae MBS have outperformed conventional MBS since the announcement.

Source: Yield Book, Santander US Capital Markets

The FHA insurance premium has not been this low since 2010. Premiums were 55 bp in the years leading up to the 2008 financial crisis. In late 2010, the FHA received Congressional approval to raise premiums above 55 bp in order to rebuild capital, but the insurance fund ultimately received a cash infusion from the US Treasury. Premiums peaked at 135 bp before dropping to 85 bp in early 2015. The FHA runs the risk that a future credit event could require it to raise premiums again, since 55 bp proved too low during the financial crisis. On the other hand, premiums are unlikely to fall below 55 bp so investors should no longer need to worry about premium reductions.

The new insurance premium, 55 bp, is effective for loans endorsed by the FHA starting on March 20 and applies to most FHA borrowers. Loans with loan-to-value ratios at or below 90% get the same 30 bp reduction but drop to 50 bp from 80 bp. Loans originated before June 2009 already would pay a 55 bp annual premium after refinancing, so are not affected by the new policy.

The FHA is also correcting an issue for certain borrowers in more expensive areas. The FHA assesses an extra 20 bp to loans larger than 2013’s high-cost area limit of $625,500. However, home price appreciation pushed the 2022 and 2023 base conforming limit over that threshold, such that some conforming balance loans were assessed the 20 bp surcharge. Going forward that surcharge will only be paid by loans over the current base conforming limit of $726,200. The FHA will need to adjust that threshold in years that the base conforming limit increases.

Brian Landy, CFA
brian.landy@santander.us
1 (646) 776-7795

This material is intended only for institutional investors and does not carry all of the independence and disclosure standards of retail debt research reports. In the preparation of this material, the author may have consulted or otherwise discussed the matters referenced herein with one or more of SCM’s trading desks, any of which may have accumulated or otherwise taken a position, long or short, in any of the financial instruments discussed in or related to this material. Further, SCM may act as a market maker or principal dealer and may have proprietary interests that differ or conflict with the recipient hereof, in connection with any financial instrument discussed in or related to this material.

This message, including any attachments or links contained herein, is subject to important disclaimers, conditions, and disclosures regarding Electronic Communications, which you can find at https://portfolio-strategy.apsec.com/sancap-disclaimers-and-disclosures.

Important Disclaimers

Copyright © 2024 Santander US Capital Markets LLC and its affiliates (“SCM”). All rights reserved. SCM is a member of FINRA and SIPC. This material is intended for limited distribution to institutions only and is not publicly available. Any unauthorized use or disclosure is prohibited.

In making this material available, SCM (i) is not providing any advice to the recipient, including, without limitation, any advice as to investment, legal, accounting, tax and financial matters, (ii) is not acting as an advisor or fiduciary in respect of the recipient, (iii) is not making any predictions or projections and (iv) intends that any recipient to which SCM has provided this material is an “institutional investor” (as defined under applicable law and regulation, including FINRA Rule 4512 and that this material will not be disseminated, in whole or part, to any third party by the recipient.

The author of this material is an economist, desk strategist or trader. In the preparation of this material, the author may have consulted or otherwise discussed the matters referenced herein with one or more of SCM’s trading desks, any of which may have accumulated or otherwise taken a position, long or short, in any of the financial instruments discussed in or related to this material. Further, SCM or any of its affiliates may act as a market maker or principal dealer and may have proprietary interests that differ or conflict with the recipient hereof, in connection with any financial instrument discussed in or related to this material.

This material (i) has been prepared for information purposes only and does not constitute a solicitation or an offer to buy or sell any securities, related investments or other financial instruments, (ii) is neither research, a “research report” as commonly understood under the securities laws and regulations promulgated thereunder nor the product of a research department, (iii) or parts thereof may have been obtained from various sources, the reliability of which has not been verified and cannot be guaranteed by SCM, (iv) should not be reproduced or disclosed to any other person, without SCM’s prior consent and (v) is not intended for distribution in any jurisdiction in which its distribution would be prohibited.

In connection with this material, SCM (i) makes no representation or warranties as to the appropriateness or reliance for use in any transaction or as to the permissibility or legality of any financial instrument in any jurisdiction, (ii) believes the information in this material to be reliable, has not independently verified such information and makes no representation, express or implied, with regard to the accuracy or completeness of such information, (iii) accepts no responsibility or liability as to any reliance placed, or investment decision made, on the basis of such information by the recipient and (iv) does not undertake, and disclaims any duty to undertake, to update or to revise the information contained in this material.

Unless otherwise stated, the views, opinions, forecasts, valuations, or estimates contained in this material are those solely of the author, as of the date of publication of this material, and are subject to change without notice. The recipient of this material should make an independent evaluation of this information and make such other investigations as the recipient considers necessary (including obtaining independent financial advice), before transacting in any financial market or instrument discussed in or related to this material.

The Library

Search Articles