


By the Numbers
Strong performance despite lingering workouts at Fannie
Mary Beth Fisher, PhD | February 10, 2023
This document is intended for institutional investors and is not subject to all of the independence and disclosure standards applicable to debt research reports prepared for retail investors. This material does not constitute research.
A check-up on Fannie Mae’s multifamily portfolio performance shows the agency navigated the pandemic exceptionally well. In fact, this performance has been consistently strong across all post-housing crisis vintages. Periods of historically low interest rates and a decade of strong multifamily property price appreciation no doubt contributed to the very low default rates for post-2009 vintages. Both of those trends are now reversing, creating modest stress in the agency multifamily market. Past performance may not indicate future results but evaluating it can help guide investors around a few potential pitfalls and reveal property sectors that have re-stabilized post pandemic.
Overall, Fannie Mae’s multifamily portfolio performance has been much stronger across post-2009 vintage loans compared to pre-2009 (Exhibit 1). Default rates peaked at 5.6% for 2007 vintage loans, but have run consistently below 0.50% and often in the single basis points for 2010 and later vintages. Cumulative losses also peaked for the 2007 vintage at 1.31% but have so far run between 0 bp to 8 bp for post-2009 vintages.
Exhibit 1: Fannie Mae multifamily performance summary
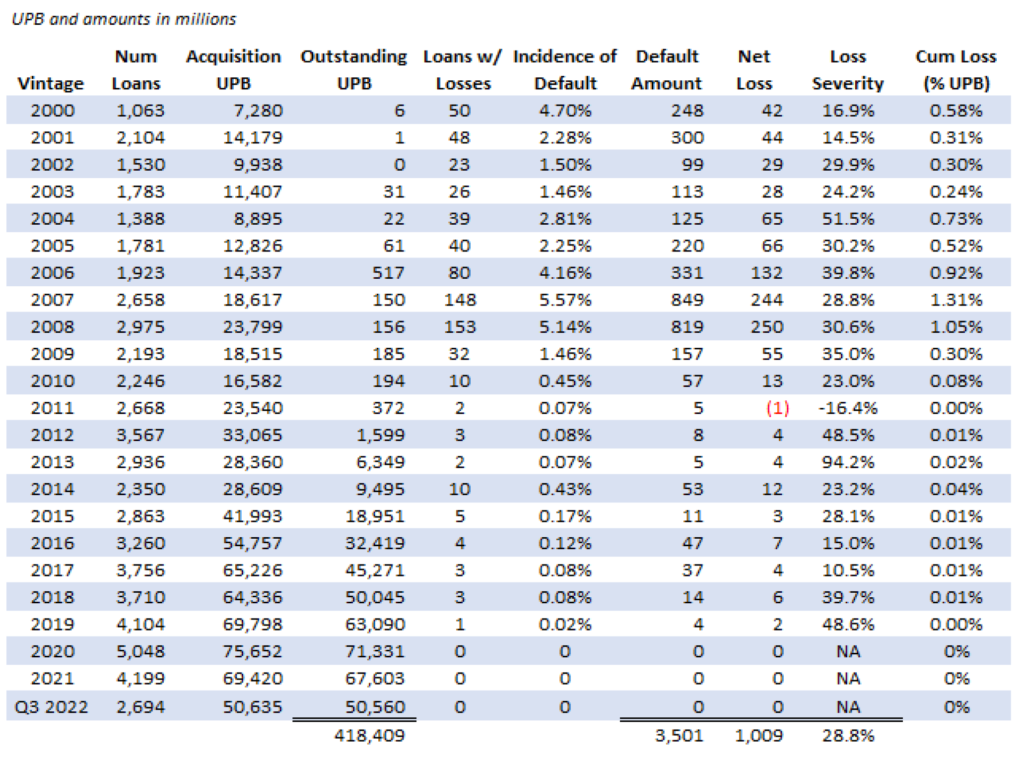
Note: A negative net loss indicates the recovery amount was greater than the defaulted amount plus costs incurred. Data through Q3 2022.
Source: Fannie Mae, SCIB US
Default rates are likely headed higher, though, because Fannie Mae continues to have a backlog of multifamily loans that are delinquent or in some stage of workout (Exhibit 2). There is good news and bad new here:
- There are 125 loans totaling $1.37 billion in unpaid principal balance (UPB) that are in some stage of delinquency or workout as of the third quarter of 2022. That compares to only 43 loans since 2010 that have defaulted and incurred losses.
- The good news is that about half of those loans totaling $718 million in UPB entered forbearance and are currently in repayment. The remaining $654 million is 90+ days delinquent and likely to incur losses.
- If the average loss severity of 28.8% is used to project losses based on those new default amounts, then projected cumulative losses across most vintages rise modestly, but remain low. The 2014 vintage is the most impacted where projected losses would rise from 4 bp to 9 bp, while the 2017 and 2018 vintages would have cumulative losses increase from 1 bp to 8 bp and 7 bp, respectively.
Exhibit 2: Projected losses based on currently delinquent loans not in forbearance repayment

Note: Cumulative losses are as a percentage of acquisition UPB. Projected losses assume the average loss severity of 28.8% of the projected default amounts. Data through Q3 2022.
Source: Fannie Mae, SCIB US
Pandemic impact versus other delinquent loans
The pandemic had a disparate impact on multifamily property types, dramatically increasing delinquency and default rates for student and seniors housing (Exhibit 3). Of the $1.37 billion that is currently delinquent, 25% is student housing and 15% is seniors housing. The good news is that most of the delinquent student housing is actually in the repayment period from forbearance and is likely to cure. Over half of the delinquent seniors housing collateral is fully in workout; not a surprise given it was the multifamily sector hit earliest and hardest by the pandemic.
Exhibit 3: Property type breakdown of delinquent loan UPB

Note: Multifamily segment includes coop and multiple property delinquencies. Data as of Q3 2022.
Source: Fannie Mae, SCIB US
The $426 million of delinquent loans never in forbearance almost entirely defaulted before to the pandemic. They are heavily multifamily with less than 10% student housing and about 5% manufactured housing. Many of these very long-term delinquencies have been in workout for years. Some of the delay in resolving defaulted loans is due to the property being in a judicial foreclosure state. These states require the lender to file a lawsuit in state court to foreclose on a property. The foreclosure process in state courts can be cumbersome and contentious, drawing out the average time to foreclose on a property from months to years.
Exhibit 4: Fannie Mae delinquency rates by state

Note: Delinquency rates are for all delinquent loans as a percentage of total outstanding loans in the state, including those in the repayment period of forbearance. Data as of Q3 2022.
Source: Fannie Mae, SCIB US
Fannie’s multifamily delinquency rates by state (Exhibit 4) are most heavily influenced by the impact of the pandemic. However, it is notable that some states with delinquency rates higher than those around them are judicial foreclosure states, including Oklahoma, Louisiana, South Carolina, Ohio, New York and New Jersey.
Property prices have started declining
The impact of the pandemic on commercial real estate performance, and multifamily in particular, was buffered by several factors:
- The forbearance and fiscal policies implemented by the government and private lenders; and by
- The astonishing surge in real estate valuations due to the combination of low interest rates and surging demand (Exhibit 5).
Multifamily property prices peaked in the second quarter of 2022 with price increases of 24% year-over-year. Those increases slowed sharply during the second half of the year, falling to around a 6% increase by the fourth quarter. The quarter-over-quarter declines have so far been just under 2% the last two quarters, but multifamily property prices are expected to continue falling through at least the first half of 2023. This is projected to eventually push the year-over-year changes negative.
Exhibit 5: Changes in commercial real estate prices across property types (year-over-year)

Note: Quarterly indices with monthly data through November 2022. CoStar Commercial Repeat Sale Indices, value weighted, shows year-over-year changes.
Source: CoStar
An environment of higher short-term interest rates and declining property prices is one that real estate markets haven’t experienced in a couple of decades. Although investors need to be cautious, Fannie Mae DUS borrowers are in a relatively strong position. The maturity wall, or percentage of outstanding multifamily loans maturing over the next few years, is quite low (Exhibit 6). Less than 2% of outstanding collateral matures this year, and just under 10% matures over the next three years. The average interest rate on the maturing loans is 4.8% this year and falls modestly over the next two years.
Exhibit 6: Maturity wall for Fannie Mae multifamily borrowers

Note: Data through Q3 2022.
Source: Fannie Mae, SCIB US
Given the inversion of the yield curve, borrowers can achieve similar to slightly higher fixed rates for 10-year terms. A surge of borrowers with floating rate loans continue to prepay as they either sell their properties or refinance into fixed-rate loans.
Although new production will likely continue to be muted during the first half of 2023, there could be a modest rise in agency fixed-rate issuance as borrowers find their interest rate caps on floating rate loans too expensive to replace.