


The Big Idea
Pivoting around the FHLBanks
Steven Abrahams | February 4, 2023
This material is a Marketing Communication and does not constitute Independent Investment Research.
The FHLBanks in the last year have returned full strength to their role as lender, investor, borrower and risk manager. And that has set parts of the debt markets in motion as the system shifts into gear following a few years of Covid-induced torpor. Banks are seeing the impact on marginal cost of funds, agency MBS and CMBS on spreads, debt markets on supply of FHLBank debt and derivatives markets on swap and option demand.
The FHLBanks are lending
The return of the FHLBanks owes much to Fed policy and its impact on bank liquidity. After all, the FHLBanks make loans to the commercial banks and insurers that join the system so those members can make or buy mortgage loans or finance MBS. When Fed QE ultimately flooded banks with deposits in the initial years of Covid, member demand for FHLBank loans plummeted. Now that the Fed is slowly withdrawing cash through QT, banks are seeing deposits start to dry up. And with banks interested in freeing up deposits used to finance mortgage loans and MBS for use elsewhere, presto, bank demand for FHLBank loans has come storming back. Through the third quarter of last year, FHLBank loans, known as advances, jumped $304 billion—an 87% increase from the start of the year (Exhibit 1).
Exhibit 1: Demand for FHLBank advances comes storming back
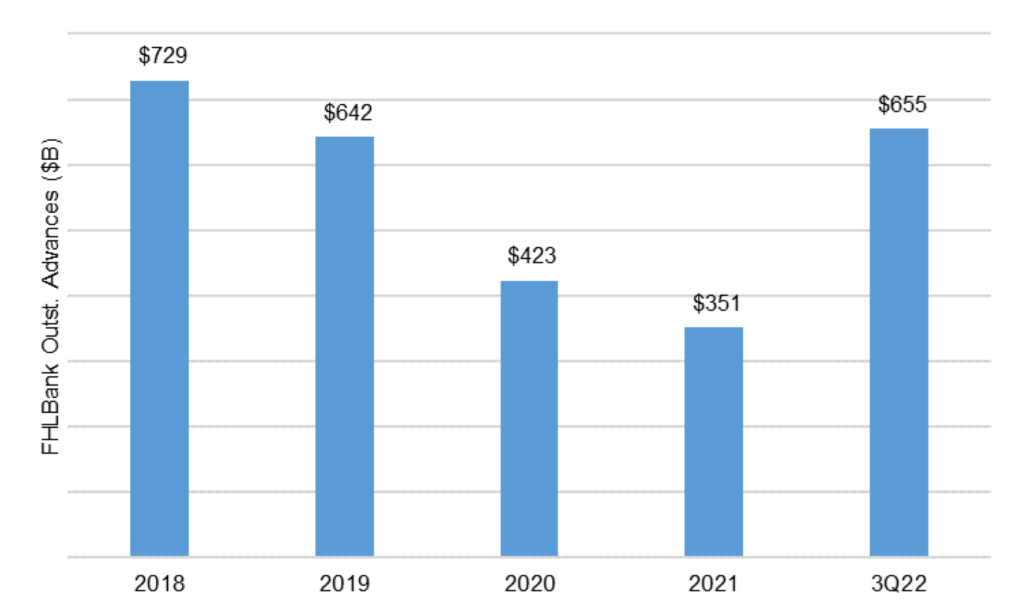
Source: FHLBank Office of Finance
FHLBank advances have become a major influence on marginal bank cost of funds. And although advance balances for the fourth quarter are still pending, demand for advances anecdotally remains strong.
The FHLBanks are building capital and investing
The surge in demand for advances has turbo charged FHLBanks capital. One unique feature of the system is that capital broadly varies with demand for advances. The system is organized as a co-op. And each bank or insurer that joins a FHLBank invests initial capital on joining and marginal capital with each advance it takes out—each FHLBank paying a dividend on the capital and eventually repaying it as each advance matures. But the bigger point is that the recent surge in advances has stoked the FHLBanks with fresh new capital. Through the third quarter of last year, system regulatory capital jumped $14 billion—a 29% gain (Exhibit 2).
Exhibit 2: The surge in advance demand has driven up FHLBank capital
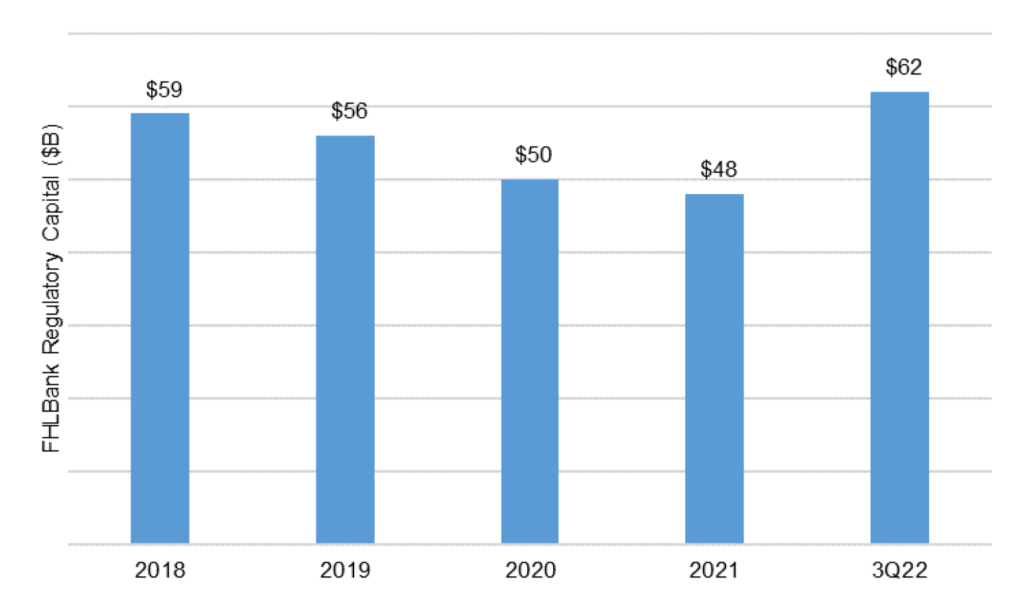
Source: FHLBank Office of Finance
With the new capital and the need to pay dividends on it, FHLBanks have found themselves scrambling to invest. The FHLBanks can buy up to $3 of MBS for every $1 of capital. In theory, the $14 billion gain in capital through the third quarter of last year unleashed $42 billion in demand for the MBS and CMBS that the FHLBanks feel comfortable buying—mainly agency MBS and CMBS these days. But that buying did not materialize, at least in synch with rising capital. FHLBank balances in fed funds, repo, cash and other liquid instruments soared over the first three quarters by $64 billion (Exhibit 3). But FHLBank portfolios of long-term investment securities—the engine that drives dividends—rose by only $2 billion, leaving $40 billion of potential investment missing in action.
Exhibit 3: Rising capital has driven up FHLBank cash but not core holdings—yet
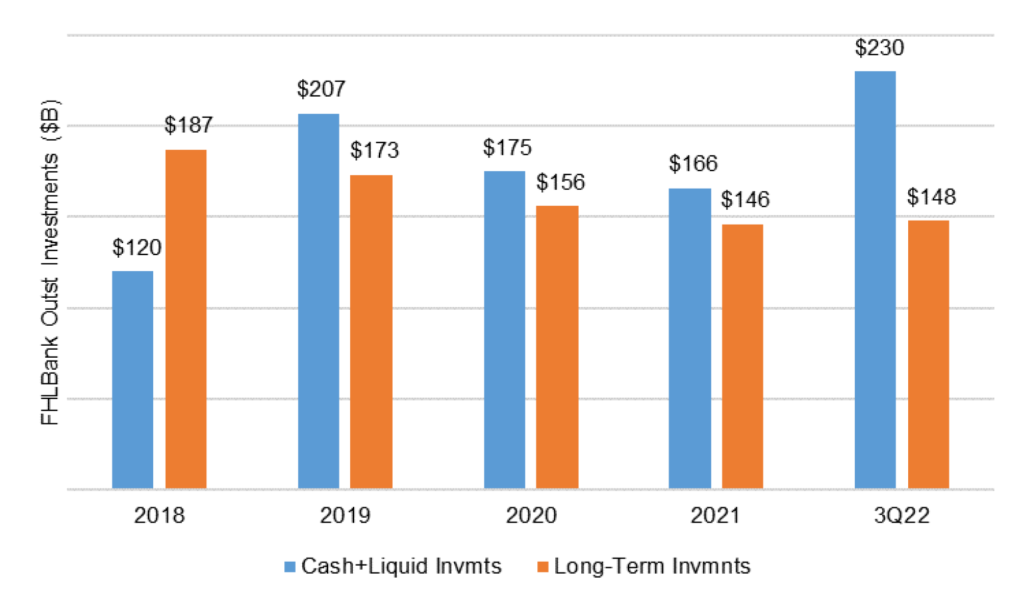
Source: FHLBank Office of Finance
With continuing demand for advances putting even more capital in FHLBank hands and stoking investment demand further, the markets where FHLBanks play have seen the effects. The FHLBanks are dominating agency CMBS and playing a sizable role in agency CMO floaters. The overhang of missing long-term investments should keep spreads in those markets relatively tight. The pressure to invest stands to push the FHLBanks to expand their investment menu or else cut dividends to member capital.
The FHLBanks are issuing debt
The need to fund advances and make long-term investments has pushed up outstanding FHLBank debt. Outstanding debt jumped by $529 billion last year and continues to rise through January (Exhibit 4).
Exhibit 4: FHLBank debt balances have jumped with advances, investments
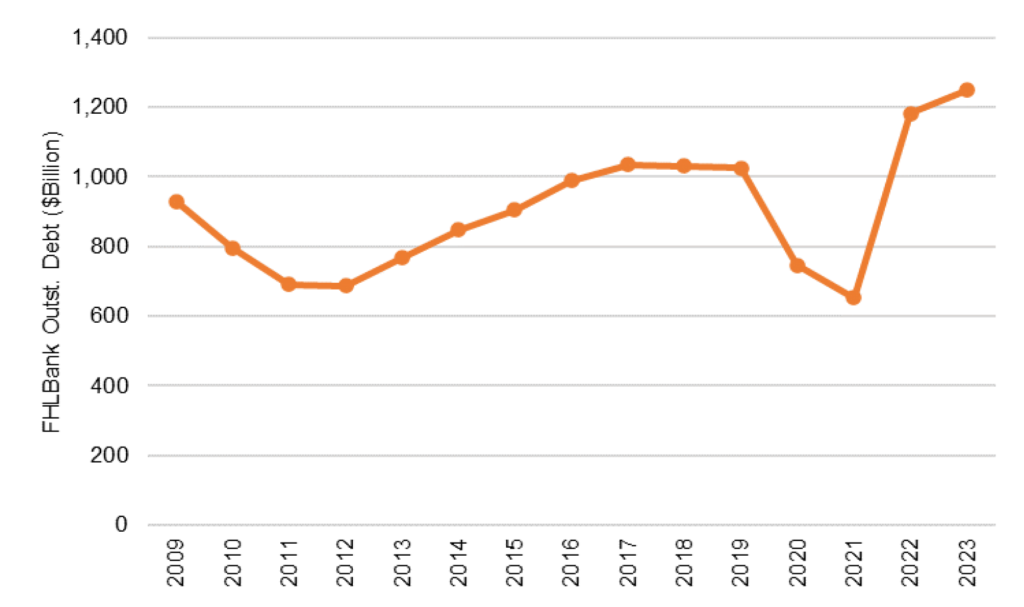
Source: FHLBank Office of Finance
The FHLBanks are hedging
The FHLBanks also actively hedge both their assets and liabilities, and hedging rises with lending and investment. They routinely buy agency CMBS, for instance, and use swaps to convert it into a floating-rate position. Some of the FHLBanks have started exploring portfolio layer hedging to manage interest rate exposure on CMOs. And FHLBanks will also issue fixed-rate debt and swap to floating, or floating-rate debt and swap to fixed to get the lowest possible cost on a target form of funding. FHLBank activity in derivatives has grown.
QT and bank ALM give the FHLBanks momentum
Fed QT should continue drawing cash out of the financial system, including off of bank balance sheets. And likely healthy loan demand through this year should keep bank appetite for wholesale funding strong. That should keep the FHLBanks active in all the areas of debt capital markets where they play as investors, issuers and risk managers. Their activity should have a heavy influence on flows and spreads.
* * *
The view in rates
OIS forward rates now see fed funds at 5% in May with only 25 bp of cuts through December. The market is starting to price in line with warnings from Fed Chair Powell and other FOMC members that the Fed will hold rates high through the end of the year.
Fed RRP balances closed Friday at $2.04 trillion, down steadily since the start of the year. With the federal government at its debt ceiling and cutting back on net new issuance, rates on short Treasury bills have become much more competitive. Banks have also started competing a little more for cash by raising deposit rates. Competitive from T-bills and bank rates may be cutting into RRP.
Settings on 3-month LIBOR have closed Friday at 481 bp, roughly unchanged over the last four weeks. Setting on 3-month term SOFR closed Friday at 469 bp, roughly unchanged over the last week. The spread between 3-month SOFR and LIBOR has renormalized after spiking last fall.
Further out the curve, the 2-year note closed Friday at 4.29%, still rich given the risk of fed funds climbing to 5.0% or higher and remaining there into 2024. The 10-year note closed well above fundamental fair value at 3.52%.
The Treasury yield curve has finished its most recent session with 2s10s at -76 bp flatter by 6 bp over the last week. The 5s30s finished the most recent session at -5 bp, flatter by 6 bp over the last week. The 2s10s curve looks likely to invert by around 100 bp shortly before Fed tightening comes to an end. That should come by mid-year.
Breakeven 10-year inflation finished the week at 223 bp, down 9 bp in the last week. The 10-year real rate finished the week at 129 bp, up 9 bp in the last week.
The view in spreads
Volatility has continued to fall through January and into February and should continue with each reading on inflation and employment and each Fed meeting. The FOMC meeting last week left volatility relatively flat afterwards, and payrolls pushed it back up a notch. Both nominal MBS and credit spreads should tighten as volatility drops. Nominal par 30-year MBS spreads to the blend of 5- and 10-year Treasury yields closed Friday at 129 bp, unchanged on the week. Par 30-year MBS TOAS has closed Friday at 39 bp, wider by 3 bp on the week.
The view in credit
Most investment grade corporate and most consumer balance sheets look relatively well protected against the likely impact of Fed tightening. Fixed-rate funding largely blunts the impact of higher rates, and healthy stocks of cash and liquid assets allow these balance sheets to absorb a moderate squeeze on income. But subprime auto borrowers, among others, are starting to show some cracks with delinquencies rising quickly. In leveraged loans, a higher real cost of funds has already started to eat away at highly leveraged balance sheets with weak or volatile revenues. The 25% of leveraged loans rated ‘B-/B3’ are especially vulnerable to downgrade. The leveraged loan market is the bellwether to watch for broader corporate and consumer credit, and stress in leveraged loans looks likely to spill over into CLOs.