


By the Numbers
Up-in-coupon and away from 15-year MBS
Brian Landy, CFA | February 3, 2023
This document is intended for institutional investors and is not subject to all of the independence and disclosure standards applicable to debt research reports prepared for retail investors. This material does not constitute research.
Mortgage spreads have tightened lately from a combination of factors. Low seasonal supply, higher demand from money managers seeing inflows, lower volatility, and lower interest rates. They add up. Option-adjusted spreads have tightened the most on higher-coupon 30-year TBAs, but moving up-in-coupon still looks like the place to be. And higher coupon Ginnie Mae TBAs continue to look undervalued compared to conventionals. The 15-year sector, however, looks rich compared to 30-year MBS. Investors should get higher returns from 30-year MBS or CMOs.
A 30-year conventional pass-through in most scenarios beats the returns of a portfolio of 2- and 10-year Treasury debt that matches the duration and market value of the mortgage-backed security (Exhibit 1). The amount of outperformance generally increases when moving to higher coupons, which helps compensate investors for the greater prepayment risk in those coupons.
Exhibit 1. Projected returns for conventional 30-year MBS rise with coupon

Note: Data shows the performance in 30-year conventional TBA MBS net of returns in a duration- and proceeds-matched portfolio of 2- and 10-year Treasury notes. All market levels as of COB 2/1/2023. Total returns in all assets assume a linear parallel shift in rates and constant OAS repricing at horizon, reinvestment in 1-month SOFR. Returns do not account for dollar rolls. Calculation details in the appendix to this note.
Source: Yield Book, Amherst Pierpont Securities.
Over the last few months option-adjusted spreads have fallen more for higher coupons than lower coupons, yet projected excess returns are still higher moving up-in-coupon. For example, on October 1 the Treasury OAS difference between FNCL 5.0%s and FNCL 2.5%s was 26.3 bp using Yield Book. The difference tightened to 7.2 bp on February 1. However, interest rates and mortgage rates have fallen over that same period, lowering MBS duration and convexity. That has a larger effect on higher coupon MBS priced near or above par. And the OAS on those coupons fell more as a result. But the base case total returns are high enough to compensate investors for the convexity risk in most scenarios.
Ginnie Mae MBS also have higher projected returns moving up-in-coupon (Exhibit 2). Conventional MBS generally outperforms Ginnie Mae MBS in lower coupons, but Ginnie Mae MBS outperforms at higher coupons. It is possible that there is greater perceived prepayment risk in Ginnie Mae MBS than conventional MBS, and that is holding down prices and lifting returns.
Exhibit 2. Projected excess returns for 30-year Ginnie Mae MBS
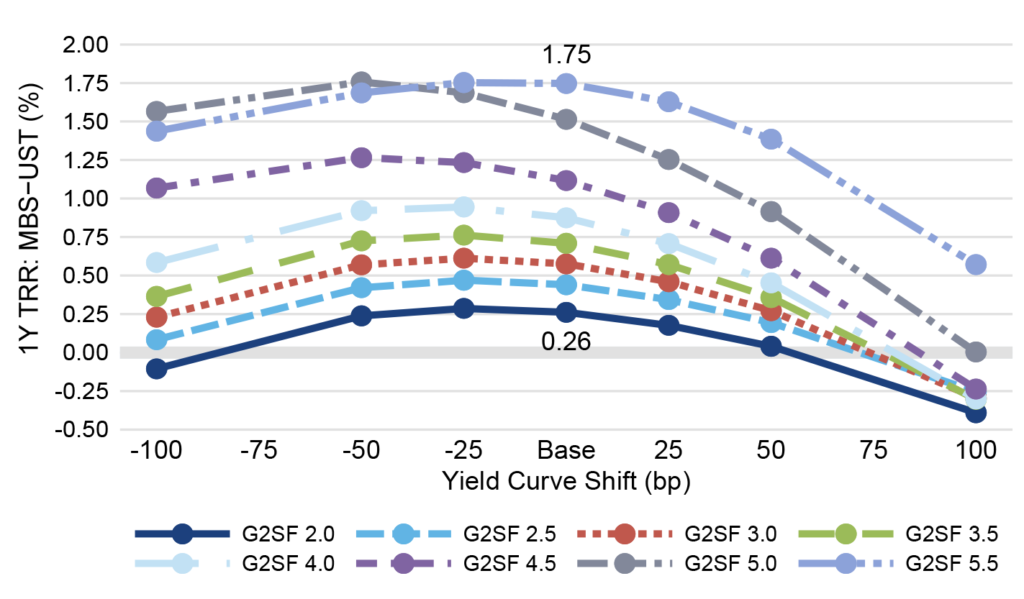
Note: Data shows the performance in 30-year Ginnie Mae TBA MBS net of returns in a duration- and proceeds-matched portfolio of 2- and 10-year Treasury notes. All market levels as of COB 2/1/2023. Total returns in all assets assume a linear parallel shift in rates and constant OAS repricing at horizon, reinvestment in 1-month SOFR. Returns do not account for dollar rolls. Calculation details in the appendix to this note.
Source: Yield Book, Amherst Pierpont Securities.
Project excess returns for 15-year MBS are well below those for 30-year MBS (Exhibit 3). For example, the FNCI 4.5% coupon is projected to return 75 bp over Treasuries in the next year, compared to 99 bp for FNCL 4.5%s. This is true at lower coupons, too. The FNCI 2.0% has a 20 bp projected excess return next year compared to 42 bp for FNCL 2.0%s.
Exhibit 3. Projected excess returns for 15-year conventional MBS

Note: Data shows the performance in 15-year TBA MBS net of returns in a duration- and proceeds-matched portfolio of 2- and 10-year Treasury notes. All market levels as of COB 2/1/2023. Total returns in all assets assume a linear parallel shift in rates and constant OAS repricing at horizon, reinvestment in 1-month SOFR. Returns do not account for dollar rolls. Calculation details in the appendix to this note.
Source: Yield Book, Amherst Pierpont Securities.
The returns show that a 30-year MBS can outperform 15-year MBS after eliminating the convexity difference (Exhibit 4). This chart compares the one-year excess return profile for FNCL 5.5%s and FNCI 4.5%s. The convexity difference is small—only 0.12 years.
Exhibit 4. 30-year MBS projected returns are consistently higher than 15-year returns

Source: Yield Book, Amherst Pierpont Securities.
The supply of new 15-year MBS has fallen considerably over the last year, and by a larger amount than 30-year MBS. For example, 15-year MBS accounted for 10% of TBA-deliverable issuance in January 2022 but only 3% in January 2023. Net supply of 15-year MBS has turned negative, even after adding back run-off from the Fed’s MBS portfolio. The lack of supply is likely driving down 15-year spreads relative to 30-year spreads and makes alternatives more attractive.
For example, a combination of a bond like GNR 2022-205 UA and 10-year Treasuries generates better 1-year total returns across a variety of interest rate scenarios than FNCI 4.5%s (Exhibit 5). The portfolio has the same duration and market value as the 15-year passthrough.
Exhibit 5. CMOs can offer higher returns than high coupon 15-year MBS

Source: Yield Book, Amherst Pierpont Securities.
Another example is FNR 2015-8, which has a similar duration to FNCI 2.0%s (Exhibit 6). Like the previous example, this bond is projected to generate higher 1-year returns than the 15-year passthrough after constructing a portfolio with the same duration and market value. In fact, this low coupon example fares even better than the prior example with a higher coupon, since down-in-coupon 15-year MBS looks rich to up-in-coupon 15-years MBS.
Exhibit 6. CMOs can also generate higher returns than low coupon 15-year MBS

Source: Yield Book, Amherst Pierpont Securities.
Finally, 30-year and 15-year MBS both outperform the benchmark 3-year Walmart corporate bond (Exhibits 7 and 8). The FNCL 5.0% and FNCI 4.0% both have similar durations to the corporate bond, and both generate higher excess returns across almost every interest rate scenario. The negative convexity of the MBS does eat into returns in bigger rate moves, especially in high-rate scenarios.
Exhibit 7. FNCL 5.0% vs Walmart 3-year bond

Source: Yield Book, Amherst Pierpont Securities.
Exhibit 8. FNCI 4.0% vs Walmart 3-year bond

Source: Yield Book, Amherst Pierpont Securities.
APPENDIX
FNCL 2.0%s

Note: All market levels as of COB 2/1/2023. Total returns assume a linear parallel shift in rates and constant OAS repricing at horizon, reinvestment in 1-month SOFR.
Source: Yield Book, Amherst Pierpont Securities.
FNCL 2.5%s

Note: All market levels as of COB 2/1/2023. Total returns assume a linear parallel shift in rates and constant OAS repricing at horizon, reinvestment in 1-month SOFR.
Source: Yield Book, Amherst Pierpont Securities.
FNCL 3.0%s

Note: All market levels as of COB 2/1/2023. Total returns assume a linear parallel shift in rates and constant OAS repricing at horizon, reinvestment in 1-month SOFR.
Source: Yield Book, Amherst Pierpont Securities.
FNCL 3.5%s

Note: All market levels as of COB 2/1/2023. Total returns assume a linear parallel shift in rates and constant OAS repricing at horizon, reinvestment in 1-month SOFR.
Source: Yield Book, Amherst Pierpont Securities.
FNCL 4.0%s

Note: All market levels as of COB 2/1/2023. Total returns assume a linear parallel shift in rates and constant OAS repricing at horizon, reinvestment in 1-month SOFR.
Source: Yield Book, Amherst Pierpont Securities.
FNCL 4.5%s

Note: All market levels as of COB 2/1/2023. Total returns assume a linear parallel shift in rates and constant OAS repricing at horizon, reinvestment in 1-month SOFR.
Source: Yield Book, Amherst Pierpont Securities.
FNCL 5.0%s

Note: All market levels as of COB 2/1/2023. Total returns assume a linear parallel shift in rates and constant OAS repricing at horizon, reinvestment in 1-month SOFR.
Source: Yield Book, Amherst Pierpont Securities.
FNCL 5.5%s

Note: All market levels as of COB 2/1/2023. Total returns assume a linear parallel shift in rates and constant OAS repricing at horizon, reinvestment in 1-month SOFR.
Source: Yield Book, Amherst Pierpont Securities.
G2SF 2.0%s

Note: All market levels as of COB 2/1/2023. Total returns assume a linear parallel shift in rates and constant OAS repricing at horizon, reinvestment in 1-month SOFR.
Source: Yield Book, Amherst Pierpont Securities.
G2SF 2.5%s

Note: All market levels as of COB 2/1/2023. Total returns assume a linear parallel shift in rates and constant OAS repricing at horizon, reinvestment in 1-month SOFR.
Source: Yield Book, Amherst Pierpont Securities.
G2SF 3.0%s

Note: All market levels as of COB 2/1/2023. Total returns assume a linear parallel shift in rates and constant OAS repricing at horizon, reinvestment in 1-month SOFR.
Source: Yield Book, Amherst Pierpont Securities.
G2SF 3.5%s

Note: All market levels as of COB 2/1/2023. Total returns assume a linear parallel shift in rates and constant OAS repricing at horizon, reinvestment in 1-month SOFR.
Source: Yield Book, Amherst Pierpont Securities.
G2SF 4.0%s

Note: All market levels as of COB 2/1/2023. Total returns assume a linear parallel shift in rates and constant OAS repricing at horizon, reinvestment in 1-month SOFR.
Source: Yield Book, Amherst Pierpont Securities.
G2SF 4.5%s

Note: All market levels as of COB 2/1/2023. Total returns assume a linear parallel shift in rates and constant OAS repricing at horizon, reinvestment in 1-month SOFR.
Source: Yield Book, Amherst Pierpont Securities.
G2SF 5.0%s

Note: All market levels as of COB 2/1/2023. Total returns assume a linear parallel shift in rates and constant OAS repricing at horizon, reinvestment in 1-month SOFR.
Source: Yield Book, Amherst Pierpont Securities.
G2SF 5.5%s

Note: All market levels as of COB 2/1/2023. Total returns assume a linear parallel shift in rates and constant OAS repricing at horizon, reinvestment in 1-month SOFR.
Source: Yield Book, Amherst Pierpont Securities.
FNCI 1.5%s

Note: All market levels as of COB 2/1/2023. Total returns assume a linear parallel shift in rates and constant OAS repricing at horizon, reinvestment in 1-month SOFR.
Source: Yield Book, Amherst Pierpont Securities.
FNCI 2.0%s

Note: All market levels as of COB 2/1/2023. Total returns assume a linear parallel shift in rates and constant OAS repricing at horizon, reinvestment in 1-month SOFR.
Source: Yield Book, Amherst Pierpont Securities.
FNCI 2.5%s

Note: All market levels as of COB 2/1/2023. Total returns assume a linear parallel shift in rates and constant OAS repricing at horizon, reinvestment in 1-month SOFR.
Source: Yield Book, Amherst Pierpont Securities.
FNCI 3.0%s

Note: All market levels as of COB 2/1/2023. Total returns assume a linear parallel shift in rates and constant OAS repricing at horizon, reinvestment in 1-month SOFR.
Source: Yield Book, Amherst Pierpont Securities.
FNCI 3.5%s

Note: All market levels as of COB 2/1/2023. Total returns assume a linear parallel shift in rates and constant OAS repricing at horizon, reinvestment in 1-month SOFR.
Source: Yield Book, Amherst Pierpont Securities.
FNCI 4.0%s

Note: All market levels as of COB 2/1/2023. Total returns assume a linear parallel shift in rates and constant OAS repricing at horizon, reinvestment in 1-month SOFR.
Source: Yield Book, Amherst Pierpont Securities.
FNCI 4.5%s

Note: All market levels as of COB 2/1/2023. Total returns assume a linear parallel shift in rates and constant OAS repricing at horizon, reinvestment in 1-month SOFR.
Source: Yield Book, Amherst Pierpont Securities.