By the Numbers
High coupons win the annual race for excess return
This document is intended for institutional investors and is not subject to all of the independence and disclosure standards applicable to debt research reports prepared for retail investors. This material does not constitute research.
MBS investors took in higher excess returns by moving up-in-coupon through most of last year, although higher coupons underperformed in December. Only the 4.5% and 5.0% coupons in both conventional and Ginnie Mae 30-year MBS posted positive excess returns for the entire year. December also saw conventional MBS outperform Ginnie Mae after lagging for much of the year. But since trading volumes dropped in December to the lowest level since 2014, performance that month may heavily reflect lower liquidity.
Most conventional MBS coupons posted modest positive returns over Treasuries in December, and the whole stack outperformed Treasury debt over the last three months of the year (Exhibit 1). The best performance came from FNCL 3.0%s, which earned 32 bp in December and 145 bp over the final quarter of the year. Meanwhile the 5.0% coupon underperformed Treasuries by 26 bp in December while still earning 111 bp in excess return over a 3-month period.
Exhibit 1. Conventional MBS excess returns (%)
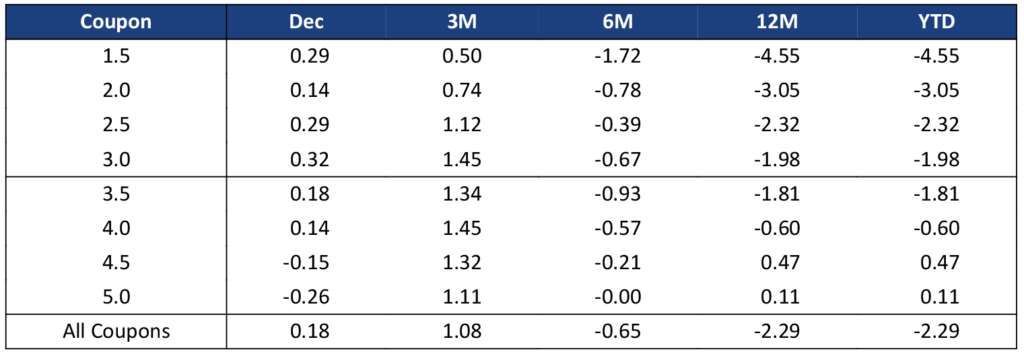
Excess returns reported by the Bloomberg Barclays MBS Index, through 12/31/2022.
Source: Bloomberg, Amherst Pierpont Securities
Ginnie Mae MBS underperformed Treasury debt across the coupon stack in December (Exhibit 2). Recent inflation reports came in better than expected, and financial markets have assumed a more dovish outlook than the Fed’s current forecast. This change in sentiment likely benefits conventional MBS more than government MBS. Over the full year, however, Ginnie Mae securities outperformed conventional securities across almost the entire coupon stack. For example, G2SF 5%s had an excess return of 101 bp, well above the conventional return of 11 bp. Another example is the 3.5% coupon, where Ginnie Mae MBS underperformed Treasury debt by 97 bp while conventional MBS underperfomed by 181 bp. In general, higher coupons did better than lower coupons, and Ginnie Mae performance compared to conventional MBS improved at higher coupons.
Exhibit 2. Ginnie Mae MBS excess returns (%)
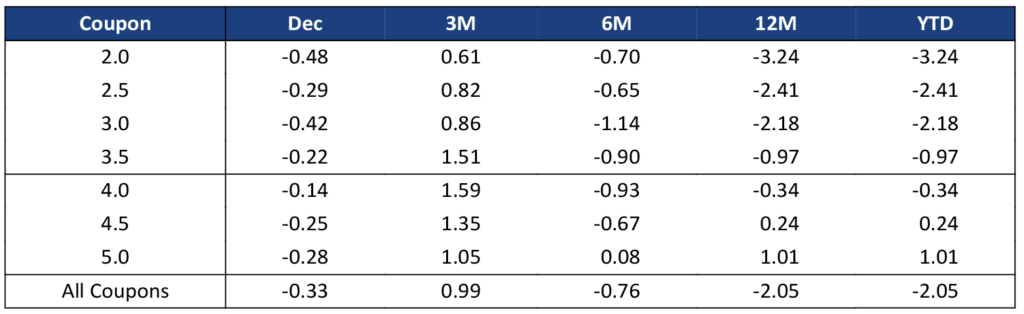
Excess returns reported by the Bloomberg Barclays MBS Index, through 12/31/2022.
Source: Bloomberg, Amherst Pierpont Securities
TBA trading volume continues to fall
TBA trading volume has fallen relatively steadily since the start of 2021 (Exhibit 3). Lower refinance originations due to high mortgage rates has reduced the demand for TBA. For example, originators need fewer TBAs to hedge origination pipelines, fewer CMOs are being made, and so on. The average level of TBA trading dropped to the lowest level of the last five years.
Exhibit 3. TBA trading volume fell to the lowest level in the last five years

The dark blue line is weekly trading volume, the light blue trend line is extracted using a Christiano-Fitzgerald filter.
Source: Federal Reserve, Amherst Pierpont Securities
Dollar roll activity has also fallen alongside TBA volumes (Exhibit 4). Activity has not been this low since late 2018, prior to the introduction of the UMBS. This is partially explained by lower origination volume. But dollar rolls are no longer regularly offering special financing, so more investors are buying specified pools instead of buying and rolling TBA.
Exhibit 4. Dollar roll usage has also fallen

The dark blue line is weekly trading volume, the light blue trend line is extracted using a Christiano-Fitzgerald filter.
Source: Federal Reserve, Amherst Pierpont Securities
A longer history shows that combined TBA and dollar roll transactions have not been this low since 2014 (Exhibit 5). And that was only for a brief time; activity has not regularly been this low since 2004. However, origination volume should pick up in the spring and summer months when housing turnover typically increases. That is likely to pull TBA and roll volumes higher.
Exhibit 5. TBA and roll volumes are at the lowest level since 2014

The dark blue line is weekly trading volume, the light blue trend line is extracted using a Christiano-Fitzgerald filter.
Source: Federal Reserve, Amherst Pierpont Securities
This material is intended only for institutional investors and does not carry all of the independence and disclosure standards of retail debt research reports. In the preparation of this material, the author may have consulted or otherwise discussed the matters referenced herein with one or more of SCM’s trading desks, any of which may have accumulated or otherwise taken a position, long or short, in any of the financial instruments discussed in or related to this material. Further, SCM may act as a market maker or principal dealer and may have proprietary interests that differ or conflict with the recipient hereof, in connection with any financial instrument discussed in or related to this material.
This message, including any attachments or links contained herein, is subject to important disclaimers, conditions, and disclosures regarding Electronic Communications, which you can find at https://portfolio-strategy.apsec.com/sancap-disclaimers-and-disclosures.
Important Disclaimers
Copyright © 2024 Santander US Capital Markets LLC and its affiliates (“SCM”). All rights reserved. SCM is a member of FINRA and SIPC. This material is intended for limited distribution to institutions only and is not publicly available. Any unauthorized use or disclosure is prohibited.
In making this material available, SCM (i) is not providing any advice to the recipient, including, without limitation, any advice as to investment, legal, accounting, tax and financial matters, (ii) is not acting as an advisor or fiduciary in respect of the recipient, (iii) is not making any predictions or projections and (iv) intends that any recipient to which SCM has provided this material is an “institutional investor” (as defined under applicable law and regulation, including FINRA Rule 4512 and that this material will not be disseminated, in whole or part, to any third party by the recipient.
The author of this material is an economist, desk strategist or trader. In the preparation of this material, the author may have consulted or otherwise discussed the matters referenced herein with one or more of SCM’s trading desks, any of which may have accumulated or otherwise taken a position, long or short, in any of the financial instruments discussed in or related to this material. Further, SCM or any of its affiliates may act as a market maker or principal dealer and may have proprietary interests that differ or conflict with the recipient hereof, in connection with any financial instrument discussed in or related to this material.
This material (i) has been prepared for information purposes only and does not constitute a solicitation or an offer to buy or sell any securities, related investments or other financial instruments, (ii) is neither research, a “research report” as commonly understood under the securities laws and regulations promulgated thereunder nor the product of a research department, (iii) or parts thereof may have been obtained from various sources, the reliability of which has not been verified and cannot be guaranteed by SCM, (iv) should not be reproduced or disclosed to any other person, without SCM’s prior consent and (v) is not intended for distribution in any jurisdiction in which its distribution would be prohibited.
In connection with this material, SCM (i) makes no representation or warranties as to the appropriateness or reliance for use in any transaction or as to the permissibility or legality of any financial instrument in any jurisdiction, (ii) believes the information in this material to be reliable, has not independently verified such information and makes no representation, express or implied, with regard to the accuracy or completeness of such information, (iii) accepts no responsibility or liability as to any reliance placed, or investment decision made, on the basis of such information by the recipient and (iv) does not undertake, and disclaims any duty to undertake, to update or to revise the information contained in this material.
Unless otherwise stated, the views, opinions, forecasts, valuations, or estimates contained in this material are those solely of the author, as of the date of publication of this material, and are subject to change without notice. The recipient of this material should make an independent evaluation of this information and make such other investigations as the recipient considers necessary (including obtaining independent financial advice), before transacting in any financial market or instrument discussed in or related to this material.


