


By the Numbers
Quick notes on container securitizations
Jason Delanty | January 3, 2023
This material is a Marketing Communication and does not constitute Independent Investment Research.
Though only a small part of securitized markets, ABS backed by marine container boxes have become an essential link in financing the global trade supply chain and an important niche for debt investors. It was no accident that the surge in international trade following the pandemic led to the highest new issue volumes on record for container securitizations. As the companies that lease containers to the world quickly tried to expand their equipment portfolios, the term ABS market provided the capital necessary to support growth. For investors new to container securitizations and interested in the yield and the exposure to global trade that they provide, it is easy to introduce the market in a few short sections:
- Role of containers in a global economy
- Sector fundamentals
- Container securitization
- ABS structure
- Risk considerations
- Pricing and relative value
Role of containers in a global economy
Containers are large steel boxes built to International Standardization Organization (“ISO”) specifications and used for moving freight from ship to shore and then by truck or rail to a final destination. Container fleet size is expressed in TEU, or 20-foot equivalent units, as a measure of a fleet’s approximate cargo-carrying capacity. Alternatively, fleet size can be measured in terms of its capital value using cost equivalent units, or CEU.
Marine containers have played an essential role in the global economy since the 1950s, and the standardization of shipping containers has greatly improved the efficiency of transporting freight across the globe. The United Nations Conference on Trade and Development (UNCTAD) estimates that more than 80% of global trade volume is transported by ship, with much of that cargo containerized. Historically, 45% to 50% of all containers worldwide get leased either from maritime shipping companies or specialty providers. As of 2021, leased containers represented more than 50% of the market. For companies whose primary source of revenue is leasing marine containers, securitization has traditionally offered a reliably efficient source of financing.
Container standardization has helped bring tremendous productivity and efficiency gains to the transport of manufactured goods, raw materials, and agricultural commodities for developed and emerging economies alike. They have largely eliminated the need to load and unload goods at each point in a distribution chain, made tracking and security easier and helped ensure proper transportation and storage conditions. Despite the apparent mechanical simplicity of the equipment, or alternatively, precisely because of it and the implication it has had for global adoption, containerized shipping remains uniquely suited to withstand the threat of obsolescence by emerging technologies. More simply, containerized trade remains the most efficient and economical solution for the international transport of goods.
Several large leasing operators own the majority of containers worldwide, and years of M&A has concentrated market share among a handful of participants. The five largest lessors now control more than 85% of the overall container rental fleet (by TEU) (Exhibit 1). Though shipping lines have historically owned a significant share of the market, operating lessors have expanded their footprint as shippers have recognized the better operational efficiency and flexibility provided by leasing:
- Equipment access without the capital expense
- Short-term solutions for managing unplanned demand, and minimization of costs created by trade imbalances where local or national exports exceed imports and create a shortage of containers at local ports
- Fleet mix flexibility offered by leasing to address the changing needs of shippers by equipment type and geographic disposition, among other factors
Exhibit 1: Container leasing market composition
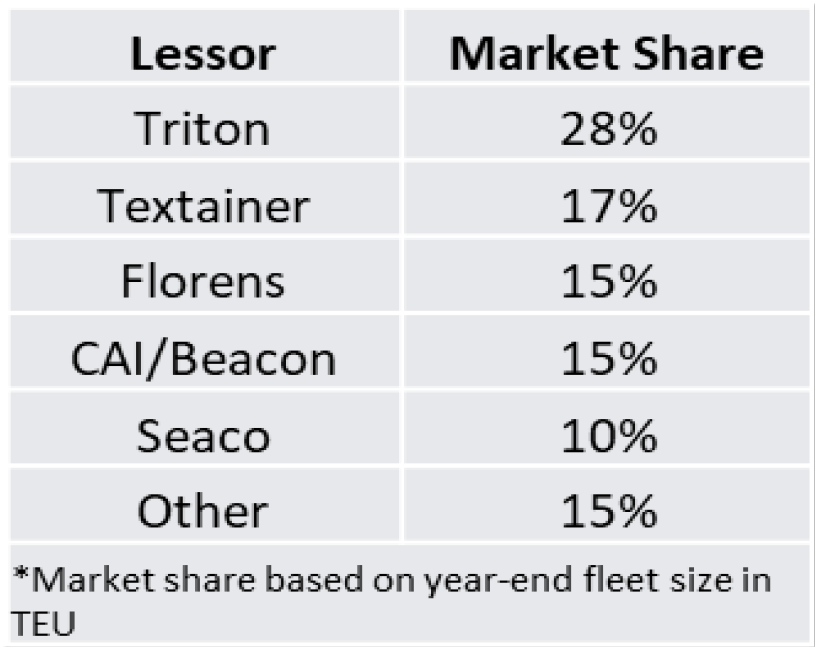
Source: Amherst Pierpont Securities, Drewry Container Census & Lease Industry Annual Report, Triton Container International
Exhibit 2: Leasing % of global container fleet
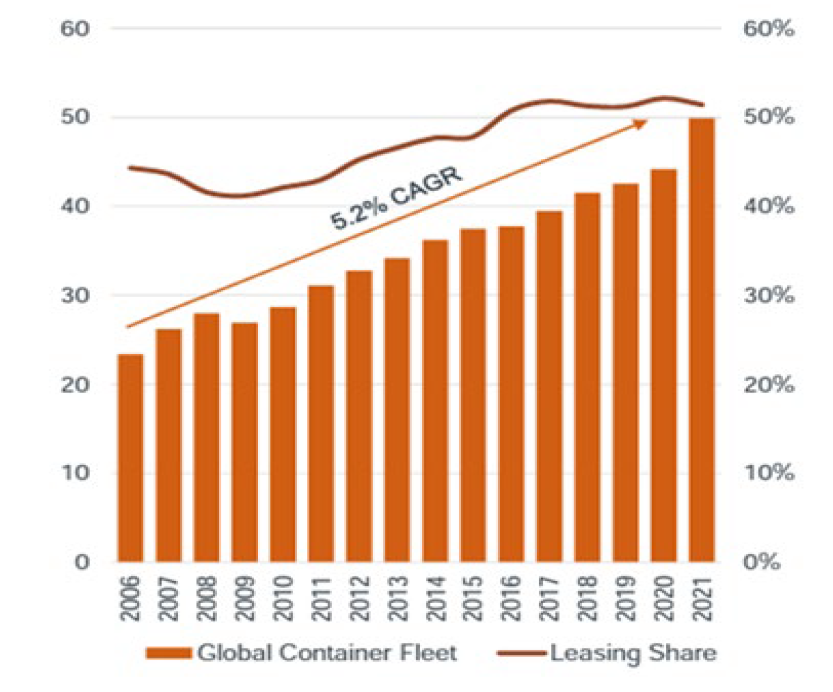
Source: Amherst Pierpont Securities, Drewry Container Census & Lease Industry Annual Report, Triton Container International
*TEU (twenty-foot equivalent unit) expresses container fleet size in terms of its approximate cargo-carrying capacity, where one 40ft container equates to two TEU, regardless of its relative dollar value. Alternatively, CEU expresses fleet size in terms of its capital value.
Sector fundamentals
After a robust recovery in 2021, container lessors face some headwinds in 2022 and possibly beyond. Among other things:
- Inflation pressures may constrain consumer spending
- The linkage between maritime connectivity, shipping, and container industry fundamentals has a measurable impact on the broader economy. UNCTAD estimates that higher grain prices and dry bulk freight rates in early 2022 contributed to a 1.2% increase in consumer food prices
- Demand for goods may normalize as consumer dollars flow back to services
- Increased retail consumption in 2021, coupled with bottlenecks across global supply chains, drove container freight rates to over 5x pre-pandemic levels. Though shipping rates are now comfortably lower than recent highs, the upward pressure on consumer goods pricing has been slow to abate, which could drive a shift in consumer spending
- Spot freight rates have collapsed over the past year. The Drewry composite index for world container rates (WCI) measures the average spot freight rate per 40-foot container—in other words, the average spot cost of a single shipment across major trade routes. As of the most recent reading in November 2022, the index is down 77% from its September 2021 peak. It is 36% lower than the 5-year average, indicating a return to more normal prices, but remains 82% higher than average 2019 (pre-pandemic) rates (Exhibit 3)
Exhibit 3: Container spot-rates
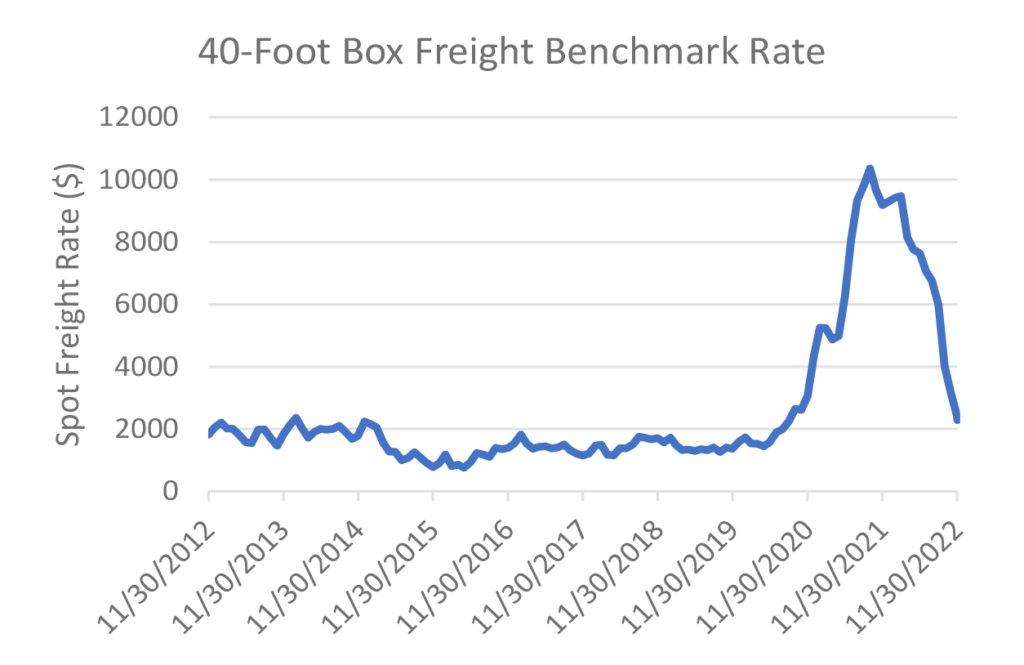
Source: Drewry World Container Index
- Weaker growth in China may lower marine container volume, as China is both the world’s largest exporter and largest container manufacturer
- As the world’s largest container exporter, China was responsible for roughly 30% of global traffic in 2021
- Ongoing geo-political conflict may shift global trade flows
- Maritime trade is strongly correlated to global output, and with macroeconomic headwinds expected to temper intermediate-term growth, constructive trends that have buoyed international merchandise trade volumes over the past two years may reverse (Exhibit 4)
Exhibit 4: Trade growth and global GDP
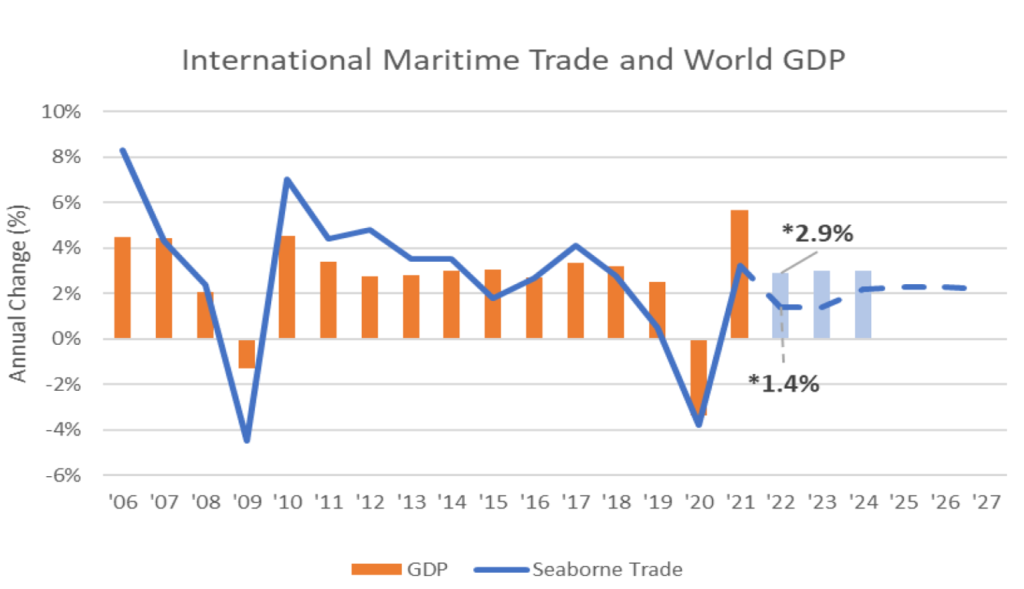
Source: UNCTAD, World Bank Economic Forecast Survey, Amherst Pierpont Securities
Container securitization
Container ABS securitization posted record volumes in 2020 following a surge in equipment demand as government pandemic stimulus spurred a recovery in global trade across major economies. Container leasing companies leveraged fundamental tailwinds—container shortages, port congestion, outsized consumer spending on goods over services—and a very attractive financing backdrop to purchase new equipment and refinance existing debt. Though issuance contracted 19% year-over-year from 2020 to 2021, new issue volume remained robust with $5.8 billion pricing in new issue across 11 transactions. But 2022 has proven a difficult financing environment for many companies, and container lessors are no exception. Wider spreads on container ABS—spreads on senior, ‘A’ rated bonds widened in 2022 by roughly 160 bp to 170 bp—forced container lessors to the sidelines. Issuance in 2022 retreated to $830 million across two deals.
Exhibit 5: Primary market volume in container ABS
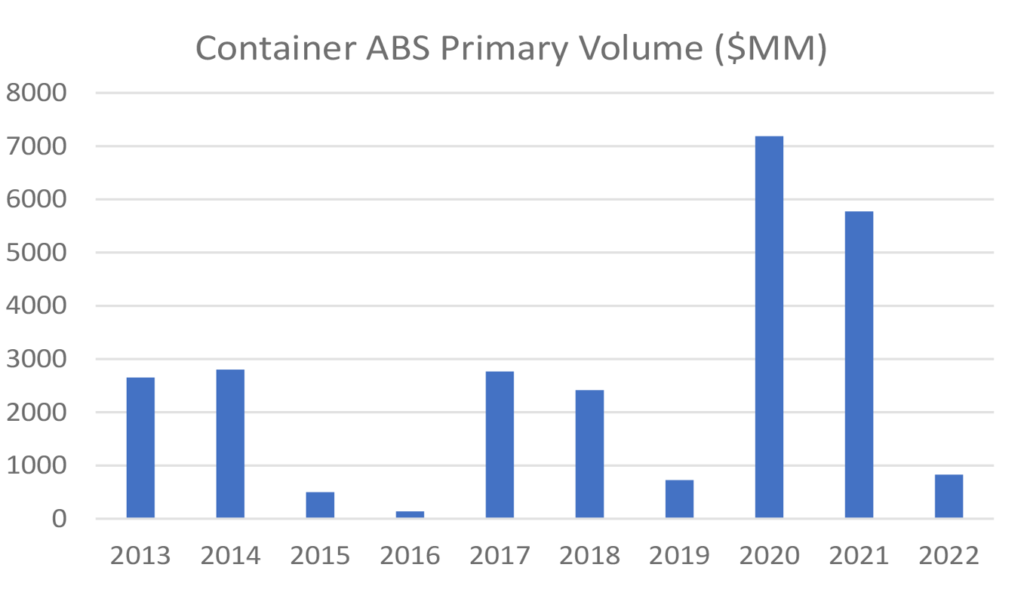
Source: Finsight
Structure
Typically, a container ABS is structured as a master trust that issues multiple series of notes. Each issue is secured by an issue-specific container portfolio, the associated container lease receivables, and proceeds from sales of containers on the secondary market. Though the pool composition will invariably change over time as collateral aging begets container sales, the inclusion criteria for any newly purchased receivables and stringent collateral concentration limits mitigate the potential for asset quality deterioration over time. Additionally, structural mechanisms such as issue-specific early amortization events, cash sweep triggers, and manager default provisions offer noteholders protection from adverse performance.
Though the average remaining lease term for most container securitizations is approximately 5 to 7 years, notes are typically structured with a 10-year assumed repayment date and a 20- to 25-year legal final maturity (Exhibit 6). This duration mismatch reflects the heightened importance of servicer involvement for container ABS relative to other term ABS securitizations. The timely repayment of outstanding ABS notes will be materially affected by a servicer’s ability to actively remarket off-lease collateral and ensure minimal cash flow disruption and effective cost management at the trust level.
Principal repayments are usually allocated pro-rata according to one of two repayment schedules:
- A minimum repayment schedule where the note balance amortizes over 15 years, and then,
- If additional funds are available, according to a targeted repayment schedule assuming note amortization over 10 years
Both repayment schedules result in note amortization that outpaces the straight-line depreciation of the overall collateral pool, thereby reducing the monthly advance rate over time. While some deals will fully amortize over the assumed term, others may be structured with a balloon paydown on an assumed repayment date.
Exhibit 6: Container ABS Structure Summary

Source: Amherst Pierpont Securities
Traditional credit positives for container ABS include:
- Value retention across the container’s useful life
- Equipment standardization provides underlying support for sector recovery rates, and a deep resale market for used containers further lends to value preservation. Specific ISO specifications to allow for interoperability across intermodal transportation systems
- Healthy growth in worldwide containerized traffic
- Robust utilization through efficient repositioning and remarketing
- Shifting lessor focus to longer lease terms, which mitigates utilization risk
Trust assets
Transactions are collateralized by issue-specific pool of containers and the receivables generated on associated leasing agreements. The trust assets are equal to the sum of i) the net book value of the container collateral, ii) the net operating income generated by the container portfolio—equal to the lease receivables less direct operating expenses, and iii) the residual cash flows from the sale of containers.
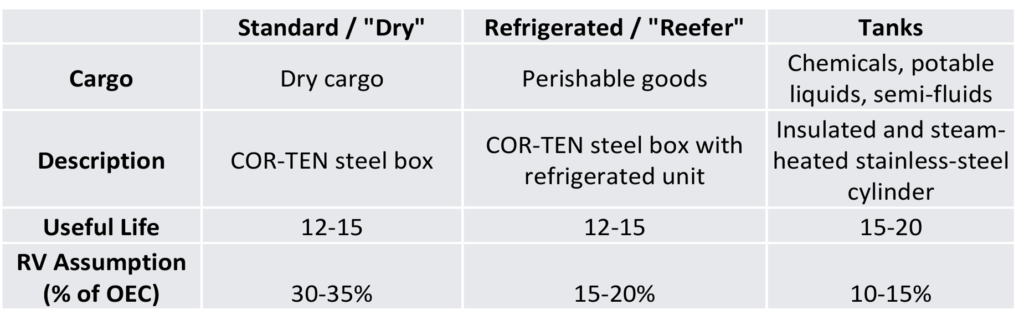
Containers
Containers are typically 8 ft wide, 8 ft 6 inches (standard) or 9 ft 6 inches (high-cube) high, and 20 ft, 40 ft, 45 ft, or 53 ft long. A typical container ABS pool usually includes a mix of the following box types (Exhibit 6):
- Dry containers, which make up roughly 90% of the global container fleet by TEU
- Refrigerated containers or “Reefers”
- Tank containers
- *Other equipment
Exhibit 7: Container type and characteristics
Source: Amherst Pierpont Securities, Fitch Ratings
*Other Equipment may include:
- Special Containers: can include open-top—a dry container without a roof—and flat rack—steel platform with folding ends and no fixed sides
- Genset: Portable diesel fueled generator sets that can be easily attached to a container to provide uninterrupted power during transport, storage, or when shore power is not available.
- Chassis: Wheeled, steel frame built specifically for transporting intermodal containers by road
Lease receivables
A shipping container’s value is partly derived from the net income generated by leasing out the equipment, which for effective leasing operators, should occur multiple times over the container’s useful life. As manager, the leasing company is responsible for the remarketing of the container fleet to maximize lease revenue and sales proceeds while minimizing direct operating expenses (DOEs). DOEs include storage costs, repositioning costs, insurance, and maintenance and repairs.
- Effective cost management depends heavily on overall fleet utilization, which for an ABS pool deriving cash flow from a group of shorter-term leases, means the manager’s ability to minimize the time it takes to re-market off-lease equipment
- For many lessors, direct operating expenses as a percentage of lease revenue have trended lower in recent years, largely attributable to the reduction in idled equipment and lower drop-off activity. For the year ending 2021, one of the world’s largest fleet lessors booked more than a 70% annual reduction in direct operating expenses, with 55% of those dollar savings derived from lower storage expenses. This was partly driven by a year-over-year 3% increase in fleet utilization, further demonstrating the importance of manager effectiveness in re-leasing off-use containers. Historically, DOEs typically amount to 7% to 10% of a lessor’s gross leasing revenue, though as indicated by the example above, these figures are meaningfully affected by storage and repositioning costs stemming from utilization and drop-off rates
Exhibit 8: Lease structures and associated risks/responsibilities
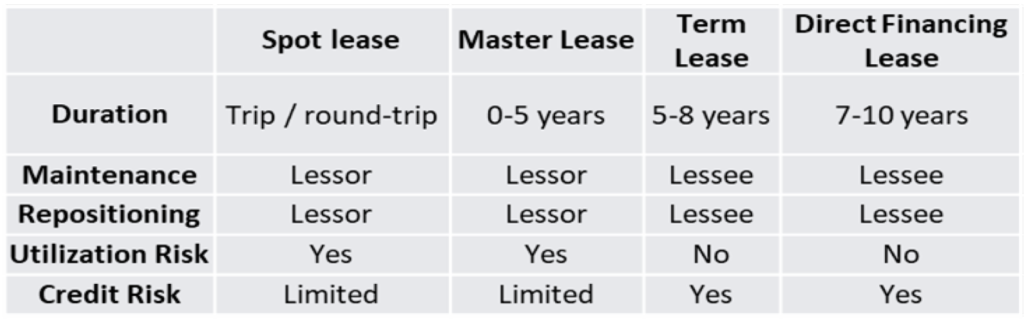
Source: Amherst Pierpont Securities
Pool composition
Important credit considerations in evaluating container ABS include a few things:
Utilization rates: Expressed as a percentage, utilization is calculated by dividing the total units on lease by total units in a fleet (in CEUs). This is the performance convention by which a lessor’s ability to generate revenue is measured, and it represents a pivotal input assumption for assessing the future cash flow stability of an ABS securitization.
- Intuitively, as a container box ages, the risk of failing to re-market the equipment into a long-term lease also increases. Longer term leases mitigate the risk of decreased utilization as the lessee is required to make payments as set forth in the initial contract, and not based on actual usage. For shorter term leases—where the costs associated with limited usage are borne by the lessor—revenue stability depends on consistent utilization
- Utilization risk will also differ by equipment type. As one might expect, refrigerated container utilization is better insulated from market cyclicality than dry containers given the nature of the cargo for which they are used, such as perishable food goods, temperature-sensitive medical supplies. Historically, tank containers, which are more specialized and thus more costly to own and operate, have demonstrated the greatest utilization stability
Direct operating expenses: Lessor operating expenses may include storage, repair, repositioning—the cost of physical relocation for container redeployment—and insurance costs. These expenses are typically proportional to the fleet size, and inversely related to the overall utilization rate—off-hire containers incur storage charges whereas leased containers do not. As it relates to ABS securitizations and issue-specific cash flows, operating expenses are allocated to the master trust based on TEUs without consideration for the specific equipment category. This pooling method results in cash flow exposure to performance fluctuations in the broader combined fleet, not just the assigned portfolio.
Per-diem rates: As a key influence on the cash flow generated on leased collateral, severe rental rate contraction will inevitably stress the pool of available funds for noteholder repayment. As lease rates are positively correlated with new container prices, which in turn represent a driving factor for secondary container pricing, it’s prudent to view these factors in totality when thinking about appropriate stress scenarios for a given deal.
Resale value: The leasing industry assumes an average useful economic life of a generic container of approximately 15 years from the manufacture date, with variance from that baseline determined by specific equipment type and the nature of use. A diverse range of equipment application supports consistent demand for used dry-freight containers in the secondary market, which in turn has provided stable, and relatively strong resale pricing for equipment sold after its use in the marine fleet. Specialized containers or refrigerated equipment may experience lower price realization as a percentage of the original equipment cost due to the more limited range of alternative application for aged equipment.
Container sales, and more specifically, the booked residual values from those sales, can account for a material portion of trust income, so it is important to consider the pool equipment mix and broader industry fundamentals when deriving assumptions about a pool’s future cash flows. Lessors will usually begin to consider equipment sales after two-thirds of a box’s useful life, or approximately 10 years of service. Though depreciation will vary by container, rating agencies indicate that a generic container sold at or near the end of its useful life can recover 35% to 40% of the original equipment cost. Resale pricing is affected by a number of things:
- New container prices
- Equipment type and condition
- Sale location – heavily regionalized secondary market where pricing can be determined by local circumstance
- Steel prices – High-grade steel and materials input pricing can account for as much as 50% of total manufacturing costs for new boxes
Exhibit 9: Collateral snapshot across recent deals
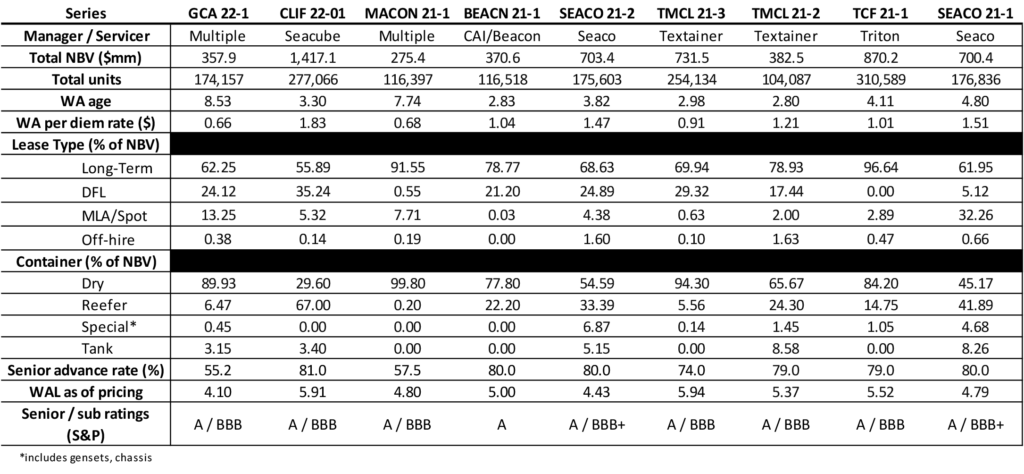
Source: S&P Global, Amherst Pierpont Securities
Bond pricing and relative value
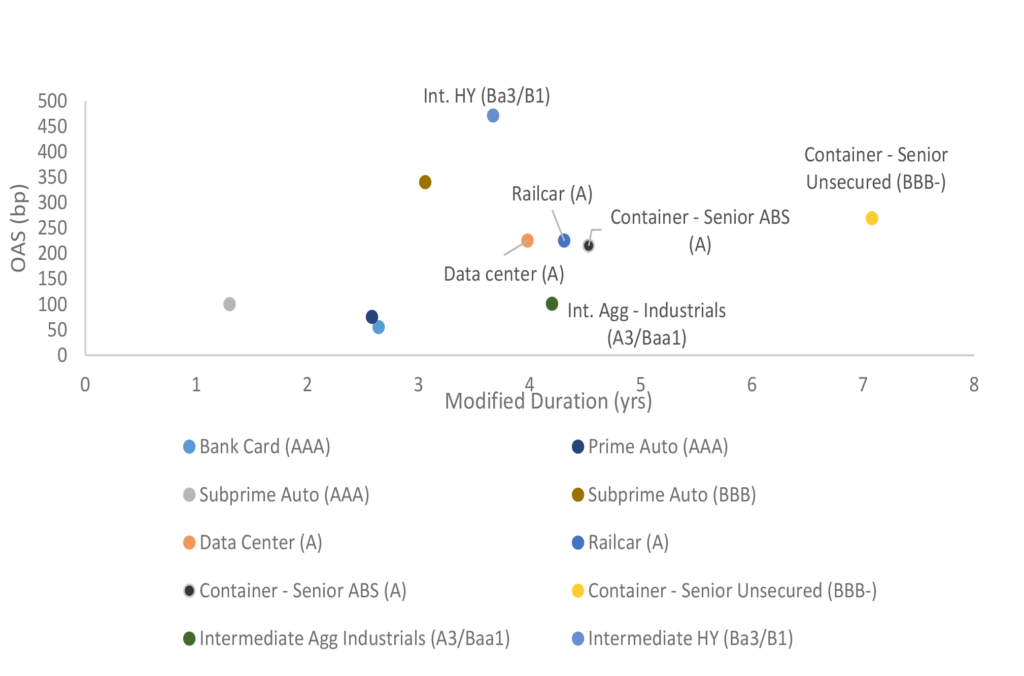
Container ABS pricing is most frequently evaluated relative to other esoteric ABS assets of similar quality and weighted average life, such as railcar and data center securitizations. Supported by both the relative size of the asset class and stronger secondary liquidity in recent years versus railcar ABS, the most liquid senior container bonds have recently priced at a 5 bp to 10 bp premium relative to railcar deals of similar average life. A similar basis currently exists between data center and container ABS, marking a reversal of the historical discount assigned to container versus top tier data center platforms like VDC and ADC—Vantage and Aligned, respectively. This recent pricing reversal makes sense in the current environment as the structural amortization of container ABS looks better than an interest-only, commercial real estate-backed alternative like data center ABS. Container investment opportunities in the securitized market also look like better relative value than lower-rated, unenhanced senior unsecured debt (Exhibit 9).
As has been the case across the ABS market, container ABS widened meaningfully through 2022, with senior pricing widening from roughly 102 bp over the interpolated Treasury curve to approximately 215 bp over the curve. Given the structural headwinds forecast for the sector, the deterioration in collateral pricing versus 2021 and continued uncertainty for the global economy going forward, the troubled spread performance for container assets in 2021 was not altogether surprising, nor without merit. However, resilient asset performance for securitized deals and favorable sector technicals should help insulate container ABS spread performance in the near term, and investors remain keen to add container risk opportunistically. Bolstered by muted supply expectations for the near term and strong two-way secondary volume, senior container ABS has tightened by roughly 70 bp since the early November. Even with the strong run of recent pricing performance, container ABS remains more than 100 bp wide to 2021 tights. If primary activity remains subdued for the near term, additional tightening is possible, especially for more seasoned profiles.
Exhibit 10: Container ABS pricing
Source: Amherst Pierpont Securities, Bloomberg