


The Big Idea
Lessons learned in markets in 2022
Steven Abrahams | December 16, 2022
This material is a Marketing Communication and does not constitute Independent Investment Research.
This year arguably marked the first time in decades that the Fed’s grip on inflation and the economy really slipped. Inflation ran way ahead of expectations, and the Fed sprinted to catch up. That gave the markets a peek at the impact of policy error. Inflation hurt the Fed. Market volatility rose and liquidity fell. Mutual funds saw sustained outflows. And those were just some of the things that had lessons to teach this year.
#1 Inflation hurt the Fed
A year ago, it seemed reasonable to expect the Fed to keep markets stable through a hiking cycle and even see volatility decline. The TIPS market expected inflation to stay on target in the long run, and Fed guidance had led rate volatility to actually decline in every post-2000 tightening cycle. But that was before the Fed got the inflation call wrong. The Fed had plenty of company. But the bad call came after the Fed shifted policy in August 2020 to allow inflation to occasionally range above target, opening the possibility that the Fed had dropped its guard. That has hurt the Fed’s ability to guide markets, at least in the short run, and likely added a volatility premium to the market going forward.
The FOMC’s median expectations of core PCE inflation for 2022 sat a year ago at 2.7% but finishes this year at 4.8%. The Fed a year ago had just pivoted from seeing inflation as transitory to seeing it as broad and persistent. Markets still expected the Fed to keep inflation under control. The TIPS market saw 5-year forward 5-year inflation just above target. But then inflation surged and broadened. The change in expected fed funds this year reflected the Fed’s scramble to catch up. Expectations for fed funds at the end of 2022 sat a year ago at 0.875% but finish this year at 4.375% (Exhibit 1).
Exhibit 1: The year’s rapid change in FOMC expectations for fed funds
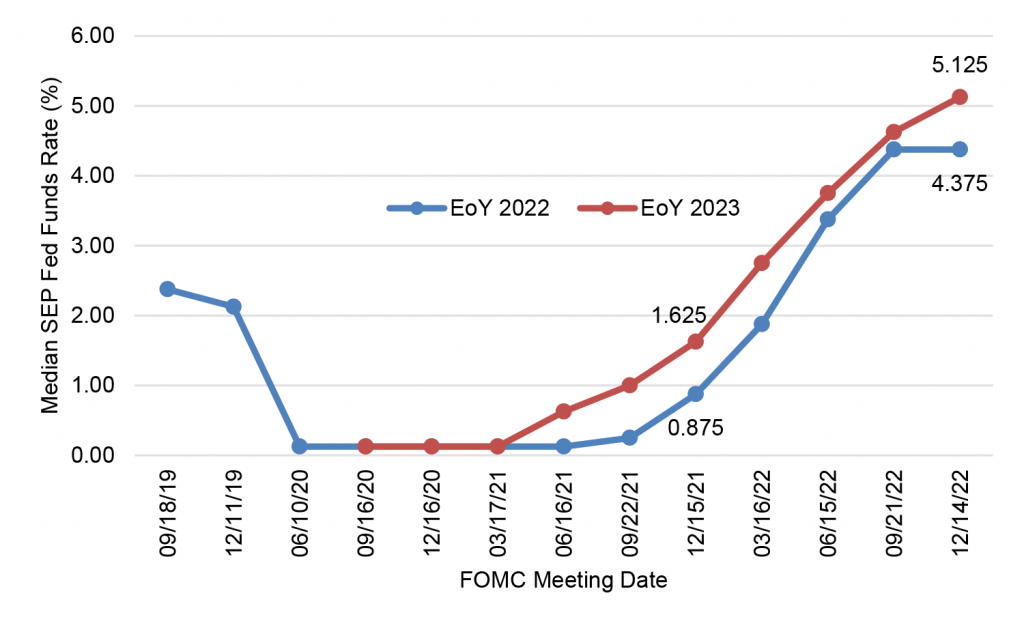
Source: Bloomberg, Amherst Pierpont Securities
The miss has created a problem for the Fed. For most of 2022, the market has consistently discounted guidance from Fed governors and private analysts that policy rates would stay high through 2023. The market priced cuts through the summer before Chair Powell said at Jackson Hole that policy rates would stay high and steady next year. After Jackson Hole, the market still priced cuts. Again after the December FOMC when Fed dots raised committee estimates of fed funds at the end of next year, the market still discounted the guidance. Fed funds futures anticipate fed funds staying flat next year at current levels with OIS forward rates pricing in cuts.
The Fed’s scramble and the disconnect between Fed guidance and market pricing has been a steady source of volatility this year that looks almost certain to continue. Volatility has tracked the Fed’s scramble to higher rates (Exhibit 2). The Fed continues to guide the market toward a fed fund rate at or above 5% through 2023. Short of a dramatic drop in core inflation and a clear trend lower—things that might lead the Fed to cut—the market will have to adjust to persistently high fed funds. That promises regular episodes of volatility.
Exhibit 2: The Fed scramble to control inflation added to implied volatility
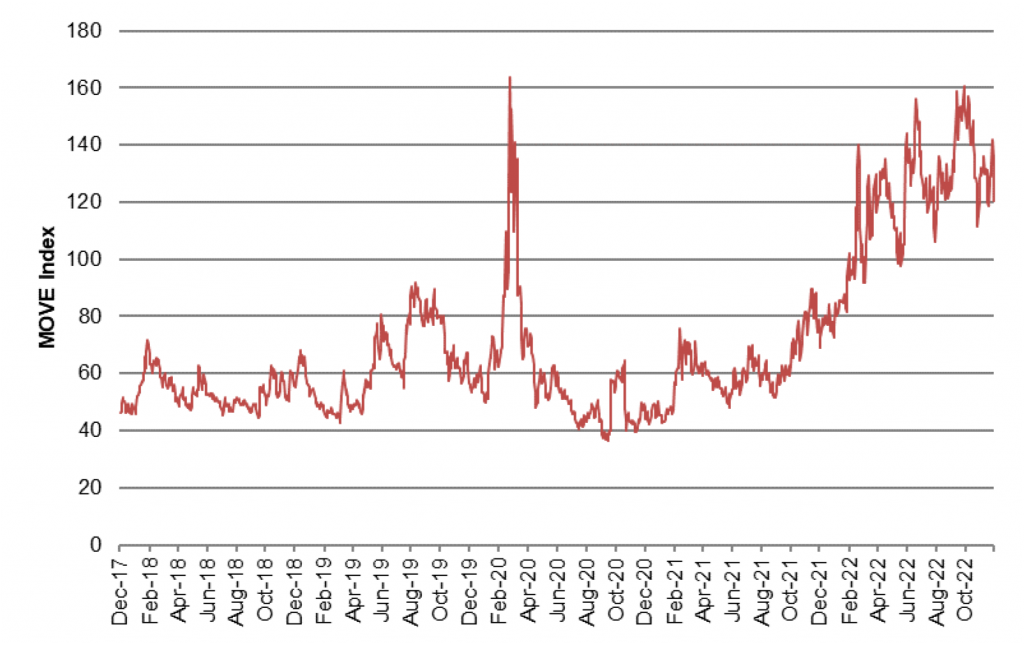
Source: Bloomberg, Amherst Pierpont Securities
Beyond next year, the Fed’s miss on inflation should keep some risk premium in the market. Most of it should be in the front end of the yield curve, with the long end still confident that the Fed can control inflation over long horizons. The lesson from this year is that the Fed, like many others staring into the future, has only a broad idea of where inflation will go next. And policy will likely pivot with the Fed’s changing view of inflation risk.
Volatility should still decline next year from current extraordinary levels as fed funds plateau and the impact of policy on inflation and the economy becomes clearer. But volatility should not get back to pre-2022 levels for a long time.
#2 Volatility hurt liquidity
Volatility in 2022 came with rising illiquidity across markets, including the Treasury market most notably. Treasury bid-ask spreads widened, the average amount of securities available at the best bid or ask price fell, the price impact of large flows rose and the dispersion of yields for similar Treasury issues—another measure of capital disciplining pricing—rose. Past markets had shown a rough relationship between expected volatility and liquidity, but 2022 put it in the spotlight (Exhibit 3). As volatility rose to levels this year that matched past episodes of market stress—the 2020 start of pandemic, the 2013 Taper Tantrum, the 2008 Global Financial Crisis, the 2003 mortgage refinancing wave and even the 1998 Russia default—measures of illiquidity rose, too.
Exhibit 3: Higher volatility has increased illiquidity in the Treasury market
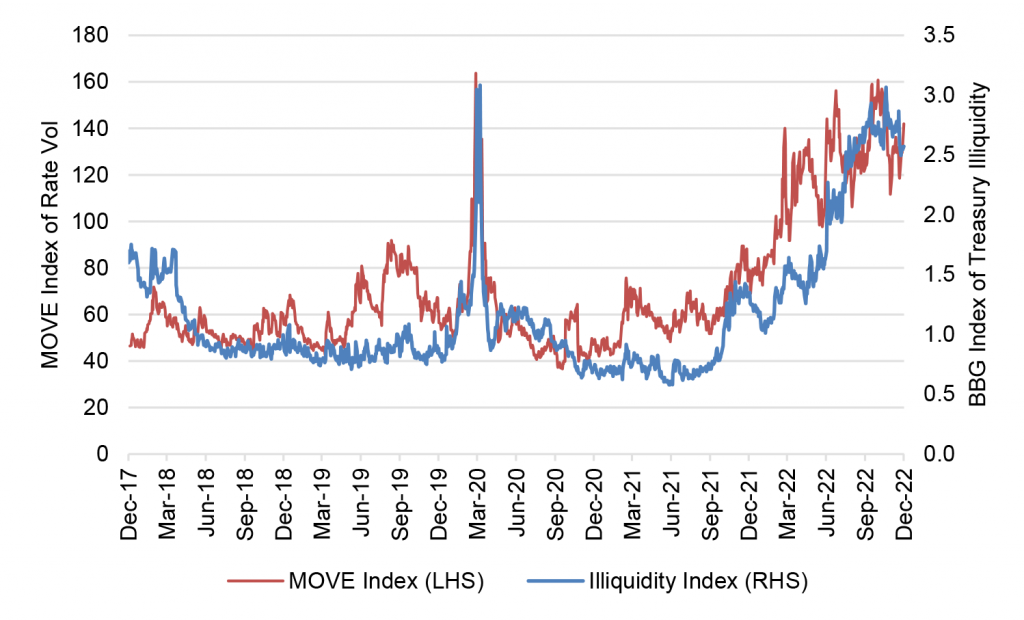
Source: Bloomberg, Amherst Pierpont Securities
The Treasury began considering buybacks to add liquidity to the market, working partly on the theory that bank regulations had discouraged dealers from holding enough inventory to smoothly intermediate between buyers and sellers. That implies a change in regulations would solve the problem.
But a competing and simpler view of the liquidity crunch argues that a market uncertain of the path of the Fed, inflation and the economy has to charge more to provide liquidity and hold inventory. This year argues that liquidity can decline in volatile markets—arguably just the moment when investors might need liquidity the most.
#3 Mutual funds magnified a bearish market
Mutual funds saw sustained redemptions in 2022, turning many of them into active sellers of both liquid and illiquid positions into a bearish market. Through November, long-term bond funds and ETFs had lost more than $296 billion in AUM, the most sustained run of redemptions in at least the last five years (Exhibit 4).
Exhibit 4: Long-term bond funds saw sustained redemptions in 2022
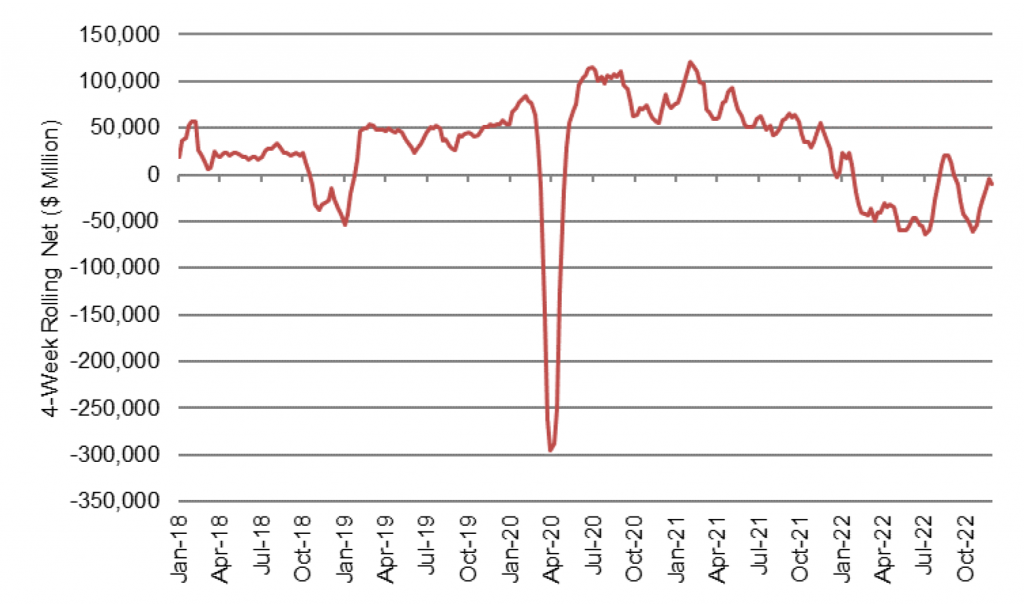
Source: Investment Company Institute, Bloomberg, Amherst Pierpont Securities
The run on mutual funds almost certainly follows the poor investment performance of debt markets this year.The Bloomberg US Aggregate Index of investment grade bond returns is down nearly 11% this year. In portfolios holding illiquid assets, the cost of funding redemptions or restocking cash rises as the most liquid holdings get sold first and less liquid holdings get sold later. This gives investors incentives to hit the exits first, with incentives growing as performance, market liquidity or asset liquidity get worse.
Work done at the University of Pennsylvania’s Wharton School shows investor redemptions from bond funds get heavier as when performance suffers, when a fund portfolio holds relatively illiquid assets or when market liquidity gets worse. This does not tend to happen in general for equity mutual funds because of that market’s deeper liquidity, the work finds, although equity funds with illiquid positions show signs of the pattern. And it does not tend to happen for bond or equity ETFs since there is no redemption mechanism to create incentives for an investor run on the fund.
Mutual fund redemptions made an important source of capital a net seller this year and impaired funds ability to policy relative value. It debt markets print positive returns next year, the relative value game should be back in play.
#4 No one can tell in advance when funding markets will run low on cash
Finally, the launch of QT started the conversation about when bank reserves, and financial system liquidity in general, will get too low. At that point presumably, if not before, QT stops. It turns out, however, that the only clear way to pinpoint when reserves and liquidity get too low is when the repo or money markets begin to show signs of stress. After all, the Fed only knew reserves had run too low in September 2019 when overnight repo rates spiked toward an annualized 10%.
The market next year may get another liquidity test. The federal government will likely hit its debt ceiling sometime in 2023. And as it approaches that ceiling, the Treasury will need to spend down cash it now holds at the Fed, the Treasury General Account or TGA. That account now stands at $342 billion but often runs much higher. While it spends down the TGA, the Treasury will be putting cash into the financial system at the same time that QT is taking cash out. But once the debt ceiling is presumably lifted, the Treasury will likely issue new bills to restock the TBA and quickly drain several hundred billion in cash out of the system. At that point, the cumulative impact of QT on system liquidity will be clearer. We will see whether it’s enough.