The Long and Short
Lessons learned in corporate credit in 2022, Part II
This material is a Marketing Communication and does not constitute Independent Investment Research.
Credit spreads proved to be much more volatile than expected this year given rate increases and an inverted Treasury curve, and that helped to paralyze the market somewhat. Additionally, large swings in the equity market helped fuel a spotty new issue market, as risk-off days spooked potential issuers. New issue concessions came back into play, forcing repricing of secondary positions. As we progressed through the year, enough cash came off the sidelines to tighten spreads in the fourth quarter. While technicals dominated for most of the year given significant ETF and algorithm trading, fundamentals did come back into play by year-end. Recession fears have some accounts looking for credits with balance sheet strength and strong cash flow profiles.
A couple of the hits and misses of 2022:
#1 Hit: Broadcom Inc. (AVGO) balance sheet improvement with new deal
In this particular piece dated in April, I highlighted how AVGO was taking advantage of the relatively low-rate environment at the time to make further capital structure improvements, which I viewed positively. I felt that AVGO’s strong margin improvement coupled with its stronger cash flow generation set the stage for stronger credit metrics and could lead to ratings improvement over the next 12-24 months. I also highlighted that acquisitions would still be a source of growth and were comforted by management’s track record in rapidly delevering post acquisition. I noted that its growing cash balance provides for flexibility in the ratings when pursuing acquisitions and that management could suspend buybacks to reduce leverage quickly should it pursue a larger acquisition. Post publication, AVGO announced its intent to purchase VM Ware (5/26/22) for a total transaction value of roughly $70bn (including assumed debt). While leverage is expected to climb to approximately 3.5x at close, management noted that they plan to bring leverage below 2.5x within two years post close. Post-acquisition announcement, AVGO was placed on review for an upgrade by S&P. Should the acquisition close with no material changes to original terms, I expect S&P will upgrade to BBB.
#2 Hit: Dick’s Sporting Goods Inc. (DKS) deep discount and steepest curve provides attractive entry point
In the DKS piece written in September of this year, I highlighted that DKS remained the widest trading credit in the BBB retail space (excluding department stores), despite having margin and credit profiles similar to or better than peers. DKS had just posted quarterly results that beat consensus estimates while raising full year guidance. Additionally, DKS was now at a point where its net sales and EBIT levels were considerably higher than pre-pandemic levels. I noted that bonds issued in January 2022 were trading at a deep discount and that DKS had the steepest 10s/30s curve, providing for an attractive entry point. Since publication, DKS’ curve has collapsed the most relative to peers. In fact, some peers have actually widened. I highlight the difference in the curves of DKS and its peers in Exhibit 1. I have included the spread curves from original publication date (9/16/22) as well as where they stand today.
Exhibit 1. BBB Retail Spread Comparison
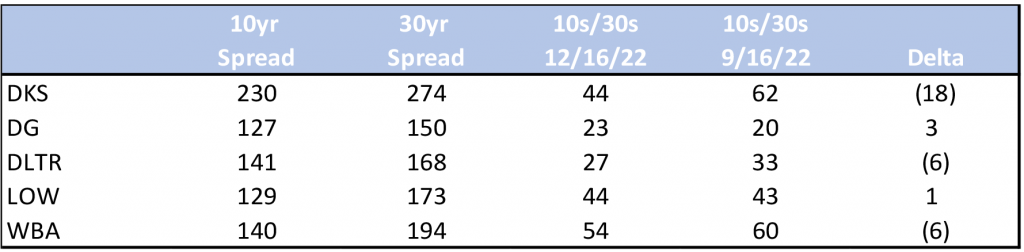
Source: Bloomberg TRACE; APS
#3 Miss: Target Corporation (TGT) inventory woes hit profit but full-year guidance affirmed
In August, I highlighted that any spread widening in TGT’s bonds on the heels of is profit warning, should be considered a better buying opportunity. TGT’s results had come in worse than anticipated, as bloated inventory levels forced management to aggressively “clear” excess merchandise. The actions led to a nearly 90% decline in EPS for the quarter. However, management was confident that the profit decline experienced in 2Q was ephemeral as it affirmed full year guidance. I noted that the balance sheet remained in order and any hit to EBITDA would not impact leverage enough to warrant a ratings event.
While ratings and outlooks have remained intact since publication, I did not anticipate TGT would reduce full year guidance on its next earnings call. TGT’s inventory issues continued to plague the credit and increased inflation and rising interest rates impacted shopping behavior which had 3Q results come in well below expectations. Furthermore, management decreased full year guidance and provided a broad range of outcomes centered around much lower sales and profit expectations. As such, TGT spreads continued to leak wider for the rest of the year. I highlight in Exhibit 2, the curve differential between original publication date and now.
Exhibit 2. TGT Spread Curve (8/19/22 versus now)
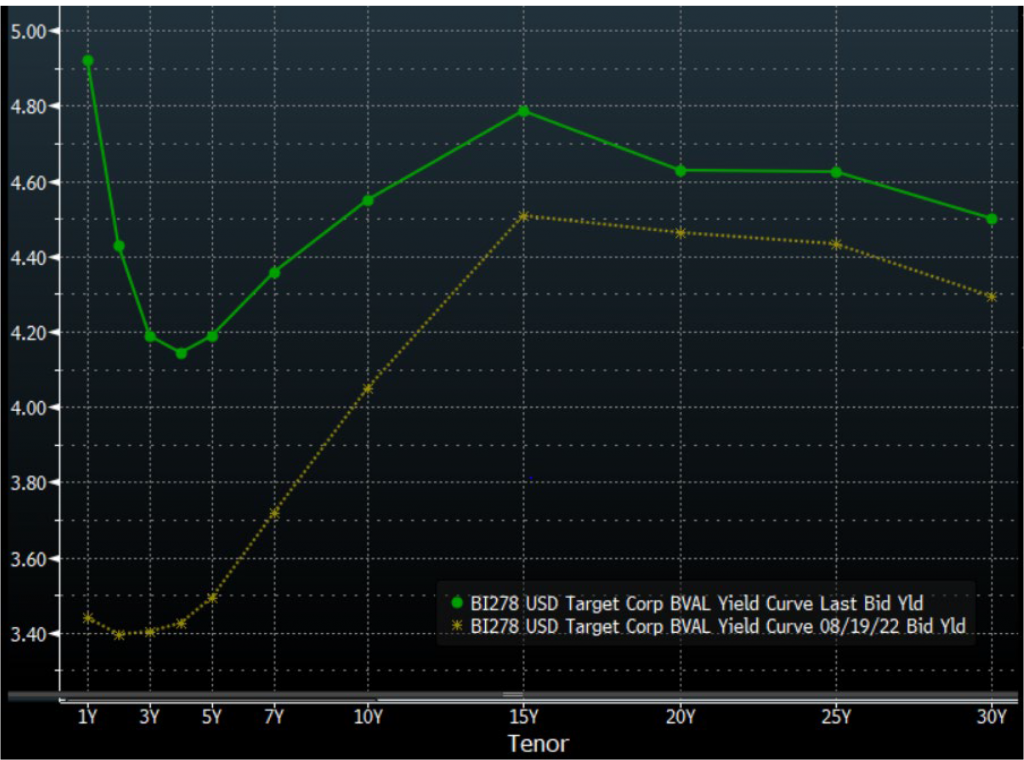
Source: Bloomberg TRACE; APS
This material is intended only for institutional investors and does not carry all of the independence and disclosure standards of retail debt research reports. In the preparation of this material, the author may have consulted or otherwise discussed the matters referenced herein with one or more of SCM’s trading desks, any of which may have accumulated or otherwise taken a position, long or short, in any of the financial instruments discussed in or related to this material. Further, SCM may act as a market maker or principal dealer and may have proprietary interests that differ or conflict with the recipient hereof, in connection with any financial instrument discussed in or related to this material.
This message, including any attachments or links contained herein, is subject to important disclaimers, conditions, and disclosures regarding Electronic Communications, which you can find at https://portfolio-strategy.apsec.com/sancap-disclaimers-and-disclosures.
Important Disclaimers
Copyright © 2026 Santander US Capital Markets LLC and its affiliates (“SCM”). All rights reserved. SCM is a member of FINRA and SIPC. This material is intended for limited distribution to institutions only and is not publicly available. Any unauthorized use or disclosure is prohibited.
In making this material available, SCM (i) is not providing any advice to the recipient, including, without limitation, any advice as to investment, legal, accounting, tax and financial matters, (ii) is not acting as an advisor or fiduciary in respect of the recipient, (iii) is not making any predictions or projections and (iv) intends that any recipient to which SCM has provided this material is an “institutional investor” (as defined under applicable law and regulation, including FINRA Rule 4512 and that this material will not be disseminated, in whole or part, to any third party by the recipient.
The author of this material is an economist, desk strategist or trader. In the preparation of this material, the author may have consulted or otherwise discussed the matters referenced herein with one or more of SCM’s trading desks, any of which may have accumulated or otherwise taken a position, long or short, in any of the financial instruments discussed in or related to this material. Further, SCM or any of its affiliates may act as a market maker or principal dealer and may have proprietary interests that differ or conflict with the recipient hereof, in connection with any financial instrument discussed in or related to this material.
This material (i) has been prepared for information purposes only and does not constitute a solicitation or an offer to buy or sell any securities, related investments or other financial instruments, (ii) is neither research, a “research report” as commonly understood under the securities laws and regulations promulgated thereunder nor the product of a research department, (iii) or parts thereof may have been obtained from various sources, the reliability of which has not been verified and cannot be guaranteed by SCM, (iv) should not be reproduced or disclosed to any other person, without SCM’s prior consent and (v) is not intended for distribution in any jurisdiction in which its distribution would be prohibited.
In connection with this material, SCM (i) makes no representation or warranties as to the appropriateness or reliance for use in any transaction or as to the permissibility or legality of any financial instrument in any jurisdiction, (ii) believes the information in this material to be reliable, has not independently verified such information and makes no representation, express or implied, with regard to the accuracy or completeness of such information, (iii) accepts no responsibility or liability as to any reliance placed, or investment decision made, on the basis of such information by the recipient and (iv) does not undertake, and disclaims any duty to undertake, to update or to revise the information contained in this material.
Unless otherwise stated, the views, opinions, forecasts, valuations, or estimates contained in this material are those solely of the author, as of the date of publication of this material, and are subject to change without notice. The recipient of this material should make an independent evaluation of this information and make such other investigations as the recipient considers necessary (including obtaining independent financial advice), before transacting in any financial market or instrument discussed in or related to this material.
Important disclaimers for clients in the EU and UK
This publication has been prepared by Trading Desk Strategists within the Sales and Trading functions of Santander US Capital Markets LLC (“SanCap”), the US registered broker-dealer of Santander Corporate & Investment Banking. This communication is distributed in the EEA by Banco Santander S.A., a credit institution registered in Spain and authorised and regulated by the Bank of Spain and the CNMV. Any EEA recipient of this communication that would like to affect any transaction in any security or issuer discussed herein should do so with Banco Santander S.A. or any of its affiliates (together “Santander”). This communication has been distributed in the UK by Banco Santander, S.A.’s London branch, authorised by the Bank of Spain and subject to regulatory oversight on certain matters by the Financial Conduct Authority (FCA) and the Prudential Regulation Authority (PRA).
The publication is intended for exclusive use for Professional Clients and Eligible Counterparties as defined by MiFID II and is not intended for use by retail customers or for any persons or entities in any jurisdictions or country where such distribution or use would be contrary to local law or regulation.
This material is not a product of Santander´s Research Team and does not constitute independent investment research. This is a marketing communication and may contain ¨investment recommendations¨ as defined by the Market Abuse Regulation 596/2014 ("MAR"). This publication has not been prepared in accordance with legal requirements designed to promote the independence of research and is not subject to any prohibition on dealing ahead of the dissemination of investment research. The author, date and time of the production of this publication are as indicated herein.
This publication does not constitute investment advice and may not be relied upon to form an investment decision, nor should it be construed as any offer to sell or issue or invitation to purchase, acquire or subscribe for any instruments referred herein. The publication has been prepared in good faith and based on information Santander considers reliable as of the date of publication, but Santander does not guarantee or represent, express or implied, that such information is accurate or complete. All estimates, forecasts and opinions are current as at the date of this publication and are subject to change without notice. Unless otherwise indicated, Santander does not intend to update this publication. The views and commentary in this publication may not be objective or independent of the interests of the Trading and Sales functions of Santander, who may be active participants in the markets, investments or strategies referred to herein and/or may receive compensation from investment banking and non-investment banking services from entities mentioned herein. Santander may trade as principal, make a market or hold positions in instruments (or related derivatives) and/or hold financial interest in entities discussed herein. Santander may provide market commentary or trading strategies to other clients or engage in transactions which may differ from views expressed herein. Santander may have acted upon the contents of this publication prior to you having received it.
This publication is intended for the exclusive use of the recipient and must not be reproduced, redistributed or transmitted, in whole or in part, without Santander’s consent. The recipient agrees to keep confidential at all times information contained herein.


