By the Numbers
Lessons learned in CMBS in 2022
This material is a Marketing Communication and does not constitute Independent Investment Research.
The first lesson learned is a follow-on from 2021: forbearance continued to work, supporting the commercial real estate market throughout 2022 with fundamental improvement as delinquencies trended down and defaults remained low. The second lesson is that changes in financing costs can overwhelm fundamentals. The commercial real estate market peaked at the end of 2021 as low financing costs drove a historic surge in transactions, pushing property prices to record highs and capitalization rates to record lows. The Fed’s torrid pace of rate increases has driven financing costs sharply higher, transaction volume down and property prices in some sectors have started to roll over.
#1 Forbearance continued to work
Throughout 2022, commercial real estate (CRE) loan performance steadily improved. The percent of delinquent CMBS loans in conduit or single-asset, single borrower deals continued to decline from a pandemic peak of over 10% in June 2020 to below 3% by September 2022 (Exhibit 1). Forbearance policies allowed most delinquent borrowers to eventually cure missed payments and reperform. The inventory of real estate owned (REO) properties remained relatively stable around $5 billion throughout the pandemic, interrupting the relatively steady, years-long decline in REO inventory since its peak of $20 billion in late 2012.
Exhibit 1: CMBS delinquency and special servicing rates show steady improvement
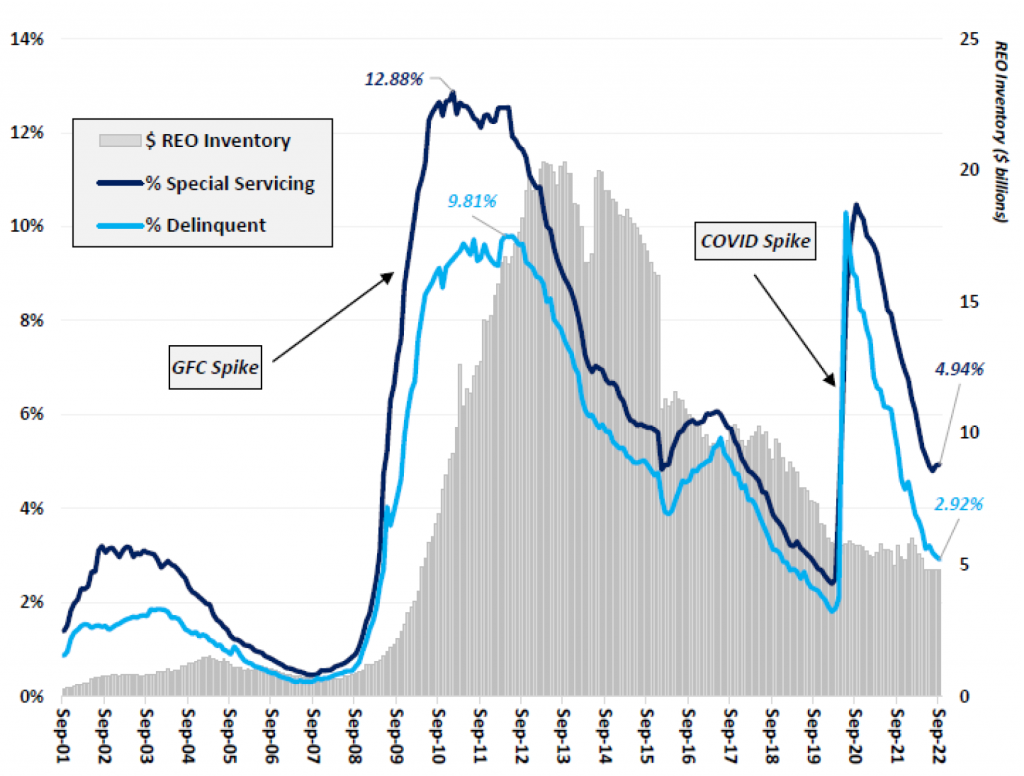
Note: Includes both conduit and SASB. Loans in forbearance are marked delinquent. Includes loans delinquent during the grace period (1.8%), 30 days delinquent (0.2%), 60 days delinquent (0.0%), 90 days delinquent (0.6%), in foreclosure (1.0%), REO (0.8%) and and non-performing matured balloon (0.4%). Data through September 2022.
Source: CREFC Monthly Update on CRE Debt Marketplace, Intex, Trepp.
The majority of remaining delinquencies continue to be concentrated in the hotel and retail sectors, both of which suffered the worst impact from the pandemic (Exhibit 2). In December 2019, just prior to the pandemic, the lodging sector had the second lowest delinquency rate at 1.42% among the major property types. By June 2020 that rate jumped to over 24%, the highest delinquency rate of any property type, as hotel borrowers entered into forbearance agreements to manage through the shutdowns. Retail properties had a similar delinquency path, but both sectors have steadily improved with most borrowers curing forbearance. Delinquency rates in the multifamily, industrial and office sectors were lower than their pre-pandemic levels by September 2022.
Exhibit 2: Lodging and retail account for largest share of CMBS delinquencies
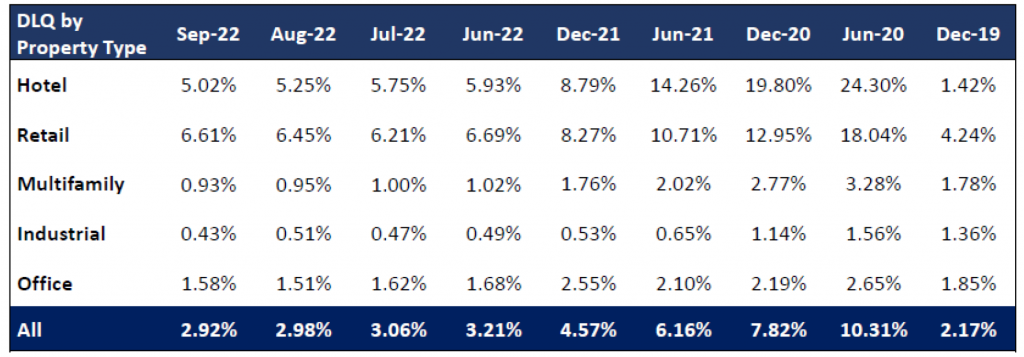
Note: Includes both conduit and SASB. Loans in forbearance are marked delinquent. Data through September 2022.
Source: CREFC Monthly Update on CRE Debt Marketplace, Intex, Trepp.
#2 Changes in financing costs can disguise fundamentals
Loan delinquency and REO rates are inherently backward-looking metrics of performance, and their ability to diagnose or reflect changes in fundamentals varies immensely across sectors.
- Hotel and retail revenues react nearly instantaneously to changes in economic conditions and consumer spending
- Multifamily revenues respond with a lag, as leases are typically for 1-year periods
- Office properties can benefit or suffer from average lease periods of 10 years; delinquency rates for office properties remain relatively benign for now, but the outlook for the sector is quite grim
However, changes in financing costs impact all CRE sectors somewhat uniformly. Financing costs influence property prices, capitalization rates and sales volume. The structural decline in long-term Treasury rates over the past 20 years has contributed to a drop in capitalization rates (Exhibit 3). Cap rates across major property sectors touched a new low during the second quarter of 2022. The time required to close a CRE sale varies from six weeks to three months, so most of the transactions closed during the quarter entered into negotiations at the end of 2021.
Exhibit 3: Capitalization rates declined as long-term Treasury rates fell
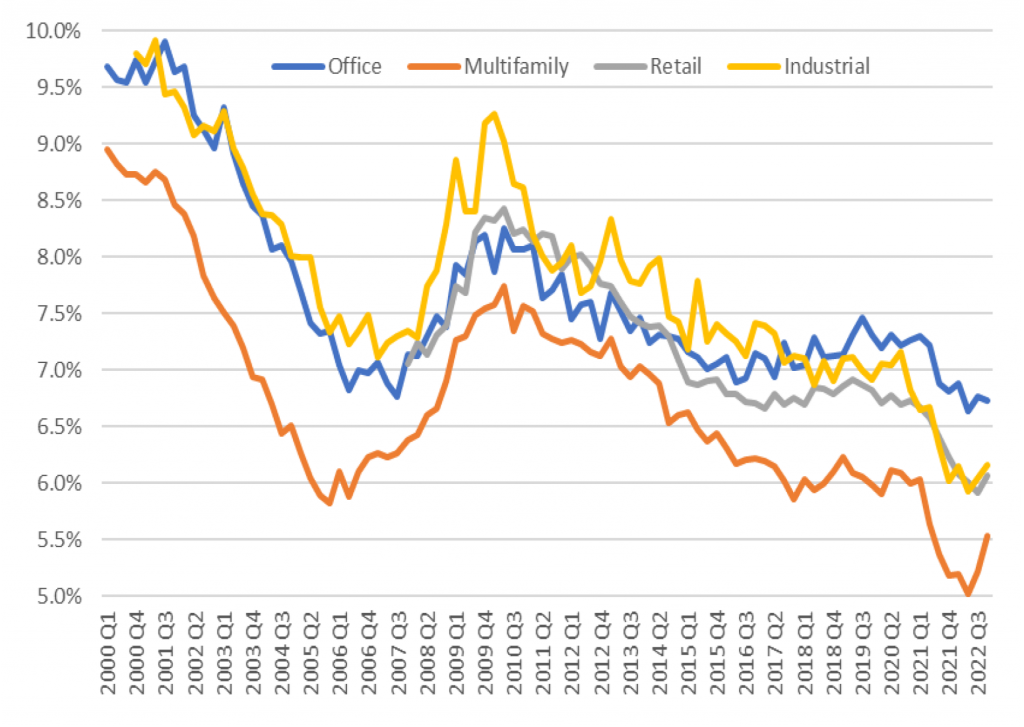
Note: Data through 12/14/2022.
Source: CoStar, Amherst Pierpont
The 10-year Treasury rate hit a historic low, remaining below 1.00% throughout post-pandemic 2020, and below 1.75% throughout 2021. Similar to residential real estate, historically low financing costs contributed to surging commercial real estate prices (Exhibit 4). Prices across most sectors peaked in early 2022, following record CRE transaction volume in the fourth quarter of 2021 (Exhibit 5).
Exhibit 4: Property prices surged as financing costs fell
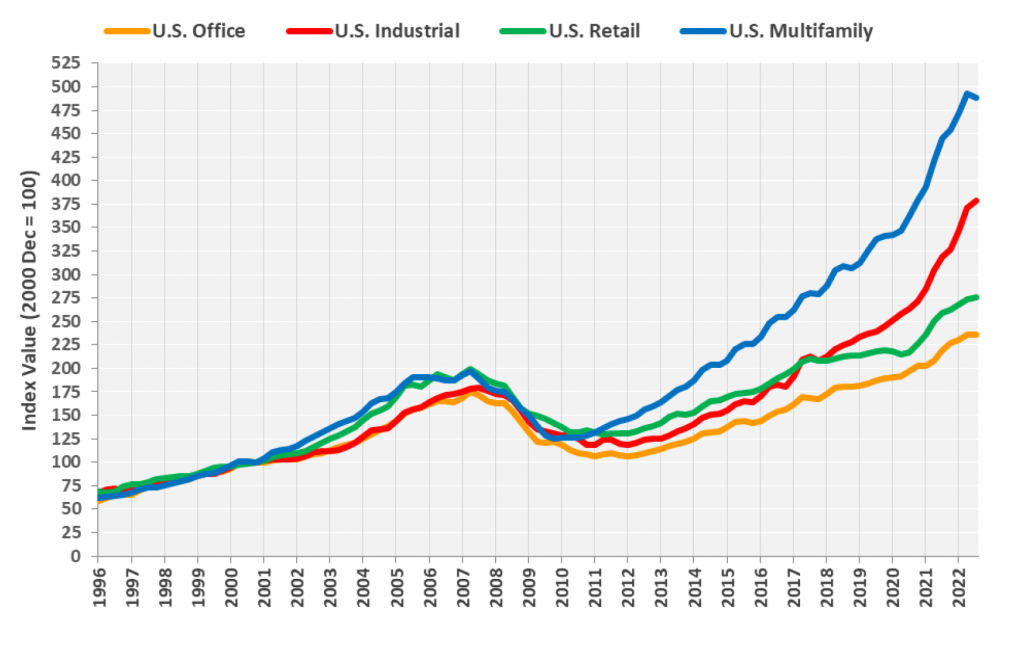
Note: CoStar property price indices, equal weighted. Quarterly data through October 2022.
Source: CoStar
CRE sales volume retreated as the Fed raised interest rates. Sales volume during the third quarter of 2022 is in-line with sales in 2019. The number of sales so far in the fourth quarter has fallen levels last seen in 2012 when the CRE market was still recovering from the financial crisis.
Exhibit 5: CRE sales volume surged as financing costs declined, but has cratered recently
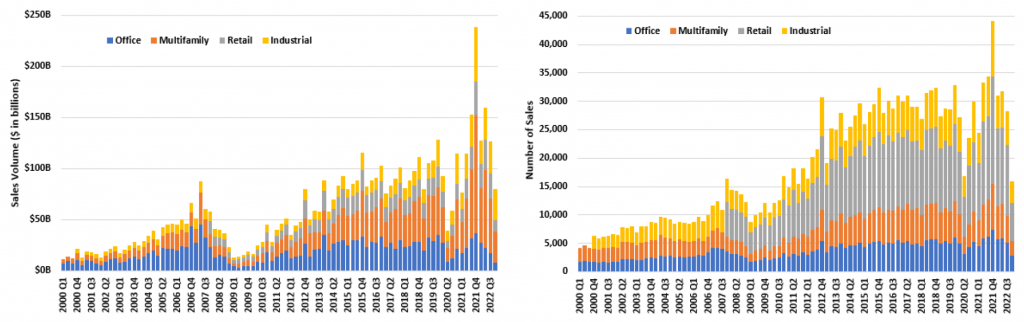
Note: CoStar capital markets data. Quarterly data through 12/14/2022.
Source: CoStar
The CRE markets have struggled to adjust to the Fed’s torrid pace of rate increases even though the long-term fundamental outlook for most sectors, ex-office, remains quite constructive. The CMBS new issue market stalled in October and has basically shut down for the remainder of 2022. The lack of supply has left spreads in the primary market at their wides of the year, but spreads in the secondary market have tightened modestly. The Fed isn’t done tightening, though they have reduced the pace. The hope going into 2023 is that the CRE market can gradually and constructively return to being driven by fundamentals without being whipsawed by interest rates.
This material is intended only for institutional investors and does not carry all of the independence and disclosure standards of retail debt research reports. In the preparation of this material, the author may have consulted or otherwise discussed the matters referenced herein with one or more of SCM’s trading desks, any of which may have accumulated or otherwise taken a position, long or short, in any of the financial instruments discussed in or related to this material. Further, SCM may act as a market maker or principal dealer and may have proprietary interests that differ or conflict with the recipient hereof, in connection with any financial instrument discussed in or related to this material.
This message, including any attachments or links contained herein, is subject to important disclaimers, conditions, and disclosures regarding Electronic Communications, which you can find at https://portfolio-strategy.apsec.com/sancap-disclaimers-and-disclosures.
Important Disclaimers
Copyright © 2026 Santander US Capital Markets LLC and its affiliates (“SCM”). All rights reserved. SCM is a member of FINRA and SIPC. This material is intended for limited distribution to institutions only and is not publicly available. Any unauthorized use or disclosure is prohibited.
In making this material available, SCM (i) is not providing any advice to the recipient, including, without limitation, any advice as to investment, legal, accounting, tax and financial matters, (ii) is not acting as an advisor or fiduciary in respect of the recipient, (iii) is not making any predictions or projections and (iv) intends that any recipient to which SCM has provided this material is an “institutional investor” (as defined under applicable law and regulation, including FINRA Rule 4512 and that this material will not be disseminated, in whole or part, to any third party by the recipient.
The author of this material is an economist, desk strategist or trader. In the preparation of this material, the author may have consulted or otherwise discussed the matters referenced herein with one or more of SCM’s trading desks, any of which may have accumulated or otherwise taken a position, long or short, in any of the financial instruments discussed in or related to this material. Further, SCM or any of its affiliates may act as a market maker or principal dealer and may have proprietary interests that differ or conflict with the recipient hereof, in connection with any financial instrument discussed in or related to this material.
This material (i) has been prepared for information purposes only and does not constitute a solicitation or an offer to buy or sell any securities, related investments or other financial instruments, (ii) is neither research, a “research report” as commonly understood under the securities laws and regulations promulgated thereunder nor the product of a research department, (iii) or parts thereof may have been obtained from various sources, the reliability of which has not been verified and cannot be guaranteed by SCM, (iv) should not be reproduced or disclosed to any other person, without SCM’s prior consent and (v) is not intended for distribution in any jurisdiction in which its distribution would be prohibited.
In connection with this material, SCM (i) makes no representation or warranties as to the appropriateness or reliance for use in any transaction or as to the permissibility or legality of any financial instrument in any jurisdiction, (ii) believes the information in this material to be reliable, has not independently verified such information and makes no representation, express or implied, with regard to the accuracy or completeness of such information, (iii) accepts no responsibility or liability as to any reliance placed, or investment decision made, on the basis of such information by the recipient and (iv) does not undertake, and disclaims any duty to undertake, to update or to revise the information contained in this material.
Unless otherwise stated, the views, opinions, forecasts, valuations, or estimates contained in this material are those solely of the author, as of the date of publication of this material, and are subject to change without notice. The recipient of this material should make an independent evaluation of this information and make such other investigations as the recipient considers necessary (including obtaining independent financial advice), before transacting in any financial market or instrument discussed in or related to this material.
Important disclaimers for clients in the EU and UK
This publication has been prepared by Trading Desk Strategists within the Sales and Trading functions of Santander US Capital Markets LLC (“SanCap”), the US registered broker-dealer of Santander Corporate & Investment Banking. This communication is distributed in the EEA by Banco Santander S.A., a credit institution registered in Spain and authorised and regulated by the Bank of Spain and the CNMV. Any EEA recipient of this communication that would like to affect any transaction in any security or issuer discussed herein should do so with Banco Santander S.A. or any of its affiliates (together “Santander”). This communication has been distributed in the UK by Banco Santander, S.A.’s London branch, authorised by the Bank of Spain and subject to regulatory oversight on certain matters by the Financial Conduct Authority (FCA) and the Prudential Regulation Authority (PRA).
The publication is intended for exclusive use for Professional Clients and Eligible Counterparties as defined by MiFID II and is not intended for use by retail customers or for any persons or entities in any jurisdictions or country where such distribution or use would be contrary to local law or regulation.
This material is not a product of Santander´s Research Team and does not constitute independent investment research. This is a marketing communication and may contain ¨investment recommendations¨ as defined by the Market Abuse Regulation 596/2014 ("MAR"). This publication has not been prepared in accordance with legal requirements designed to promote the independence of research and is not subject to any prohibition on dealing ahead of the dissemination of investment research. The author, date and time of the production of this publication are as indicated herein.
This publication does not constitute investment advice and may not be relied upon to form an investment decision, nor should it be construed as any offer to sell or issue or invitation to purchase, acquire or subscribe for any instruments referred herein. The publication has been prepared in good faith and based on information Santander considers reliable as of the date of publication, but Santander does not guarantee or represent, express or implied, that such information is accurate or complete. All estimates, forecasts and opinions are current as at the date of this publication and are subject to change without notice. Unless otherwise indicated, Santander does not intend to update this publication. The views and commentary in this publication may not be objective or independent of the interests of the Trading and Sales functions of Santander, who may be active participants in the markets, investments or strategies referred to herein and/or may receive compensation from investment banking and non-investment banking services from entities mentioned herein. Santander may trade as principal, make a market or hold positions in instruments (or related derivatives) and/or hold financial interest in entities discussed herein. Santander may provide market commentary or trading strategies to other clients or engage in transactions which may differ from views expressed herein. Santander may have acted upon the contents of this publication prior to you having received it.
This publication is intended for the exclusive use of the recipient and must not be reproduced, redistributed or transmitted, in whole or in part, without Santander’s consent. The recipient agrees to keep confidential at all times information contained herein.


