The Big Idea
Lessons learned in banking 2022
This material is a Marketing Communication and does not constitute Independent Investment Research.
Explosive loan growth and a swift rise in interest rates both cut into bank capital this year and changed the management of balance sheets. While it would be natural to assume that securities portfolios would shrink during a period of strong loan growth, the surprise was that capital became the primary driver of securities mix and accounting treatment. Portfolios piled into Ginnie Mae MBS and shifted into held-to-maturity accounts. Many of these trends should continue for much of 2023.
#1 Securities portfolios decline
A persistent theme for US banks in 2023 has been the growth of overall assets due to loan growth but a reduction in securities portfolios (Exhibit 1). For the APS tracking group of around 40 of the top 100 banks, assets in the third quarter grew by $52 billon while securities portfolios declined by $150 billion.
Exhibit 1: Securities portfolios shrinking while balance sheets grow
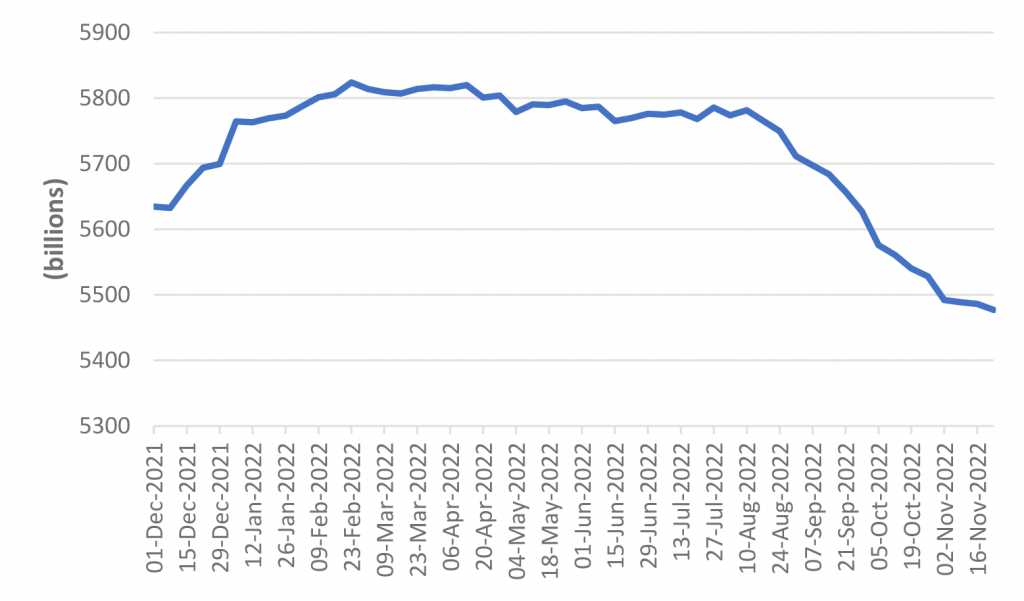
Source: Federal Reserve H.8 as of 11/23/22, Amherst Pierpont Securities
Along with the rotation out of lower risk-weight securities and into higher risk-weight loans, capital ratios deteriorated in 2022. And for most non-G-SIBs (global systemically important banks) that have been able to shield their regulatory capital ratios from declines in the value of their available-for-sale (AFS) securities portfolios, they have still experienced reductions to their tangible capital. This has pressed most banks into using the held-to-maturity (HTM) classification more heavily (Exhibit 2). For the APS tracking group, while AFS portfolios declined by over $600 billion this year through September, HTM portfolios actually increased by close to $400 billion.
Exhibit 2: HTM grows as banks look to protect book value
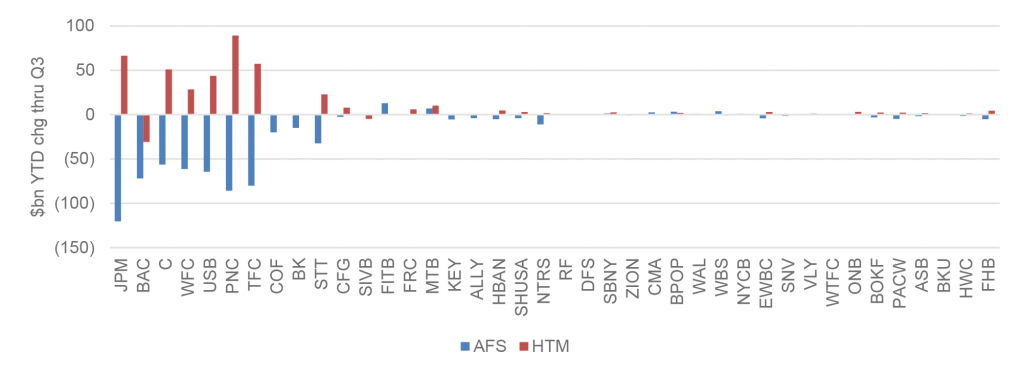
Source: S&P Capital IQ, Amherst Pierpont Securities
#2 Zero percent risk-weight asset preference with Ginnie Mae dominating
To help repair capital ratios, banks invested more heavily into 0% risk-weight (RW) securities (Exhibit 3).
Exhibit 3: 0% RW securities up 1 percentage point in 22Q3 to 18%
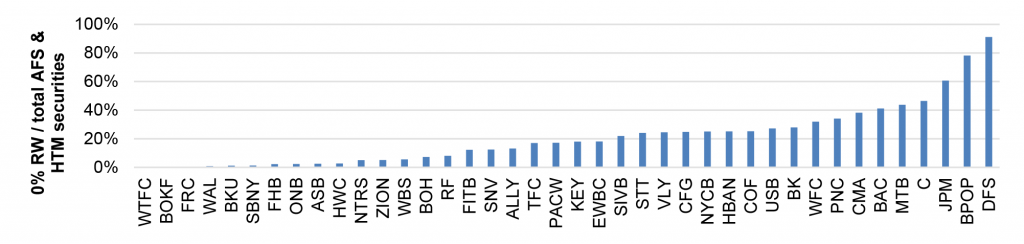
Source: S&P Capital IQ, Amherst Pierpont Securities
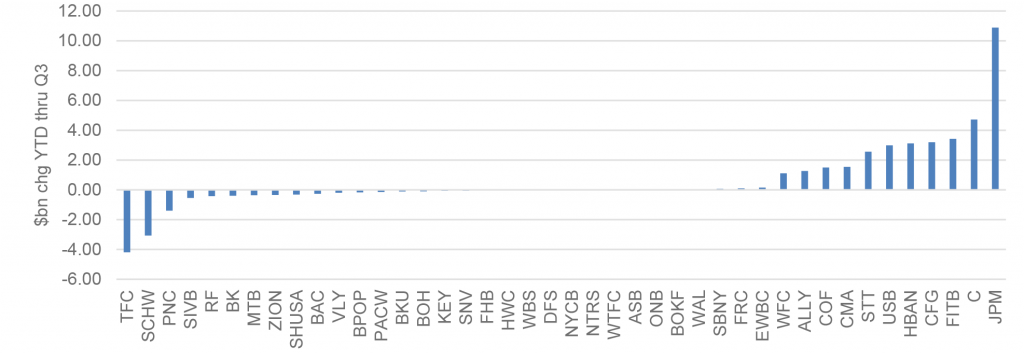
While US Treasuries carry a 0% risk-weight, they are relatively low-yielding securities and therefore are generally not a bank’s first choice (Exhibit 4). The chart below shows that most banks’ holding of Treasury debt stayed flat or declined year-to-date through September, with the APS tracking group overall seeing a $52 billion decrease.
Exhibit 4: Treasuries flat to down at most banks as they seek higher yields
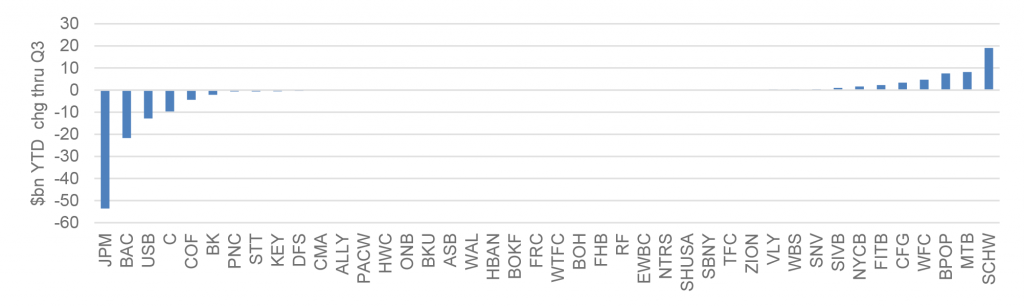
Source: S&P Capital IQ, Amherst Pierpont Securities
Instead, banks are growing their allocation to 0% risk-weight Ginnie Mae securities (Exhibit 5). For the APS tracking group, Ginnie pass-throughs increased by about $25 billion year-to-date through September and have generally been attractive from a relative value perspective. Par 30-year MBS nominal spreads are around their post crisis wides seen in early 2020, although an increase in volatility has resulted in an increase in option cost and therefore tighter option-adjusted spreads. Still, our colleague Brian Landy last week noted that Ginnie OASs tightened less than conventionals, helping to compensate investors for the greater prepayment risk and lower convexity, and that up-in-coupon Ginnie offers the best projected total returns.
Exhibit 5: Banks opting for higher yielding Ginnie pass-thrus in the 0% risk-weight arena
Source: S&P Capital IQ, Amherst Pierpont Securities
#3 Fannies, Freddies, private-label MBS and munis out of favor
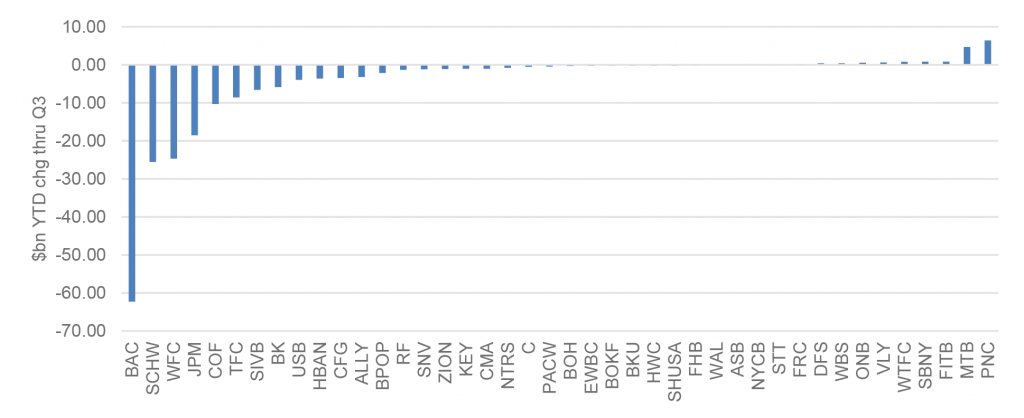
By comparison, most banks had reductions in their holdings of Fannie Mae and Freddie Mac pass-throughs year-to-date through September (Exhibit 6). For the APS tracking group, these securities declined by more than $170 billion. While offering a relatively low risk-weighting of 20%, the 0% risk-weighting of Ginnie Mae is more desirable when trying to repair capital ratios in a hurry. The same may be said for most private-label MBS, which for our tracking group, declined by 2% year-to-date through September. Some may argue that part of the decline is attributable to the general lack of new issuance volume in 2022, but part of the explanation is certainly due to risk-weightings higher than Ginnie Mae.
Exhibit 6: Fannie and Freddie securities dropped due to higher risk weights
Source: S&P Capital IQ, Amherst Pierpont Securities
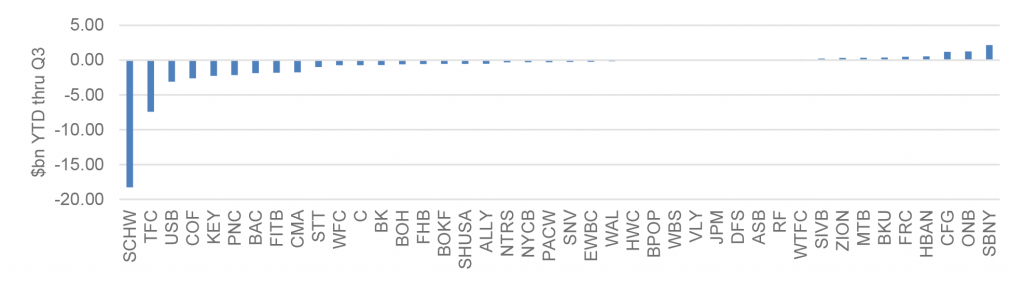
In the world of securities, another relatively high risk-weight asset class that is vulnerable when banks are trying to repair capital ratios would be state and municipal debt, where general obligation bonds carry a 20% risk-weight and revenue bonds a 50% risk-weight. For the APS tracking group where most of the banks do have muni positions, those declined by 7% year-to-date through September (Exhibit 7) with only a small handful of banks adding any meaningful positions.
Exhibit 7: Muni bonds decline as banks repair capital ratios
Source: S&P Capital IQ, Amherst Pierpont Securities
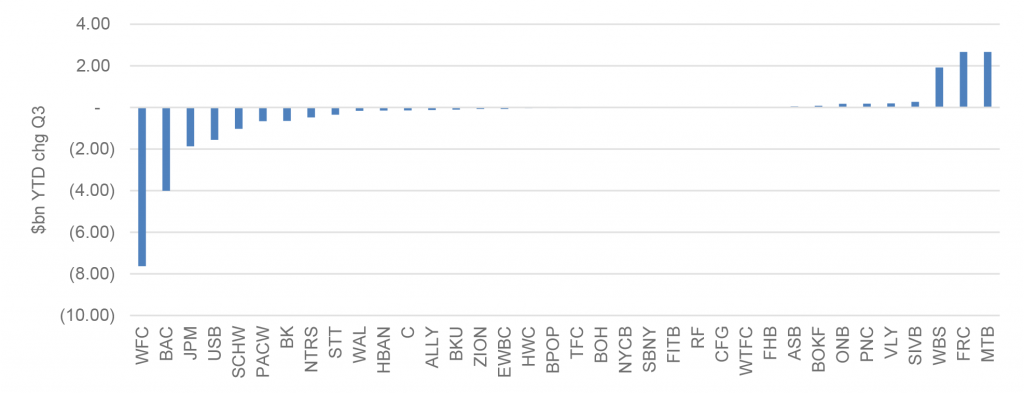
Another interesting trend in declining securities portfolios is that CMOs declined by a larger percentage than pass-throughs (Exhibit 8). For our tracking group, of agency MBS holdings, CMOs started the year at 15%, but represented 22% of the total decline of the agency MBS bucket. Some of this differential could be explained by banks selling securities to maintain liquidity and opting to sell shorter-duration CMOs where the mark-to-market hit and resulting accounting loss was lower. Although there does not appear to have been much outright selling, shorter-duration CMOs would continue to be a relatively attractive segment of the portfolio to tap in order to minimize losses.
Exhibit 8: Agency CMOs decline by a disproportionally large amount
Source: S&P Capital IQ, Amherst Pierpont Securities
This material is intended only for institutional investors and does not carry all of the independence and disclosure standards of retail debt research reports. In the preparation of this material, the author may have consulted or otherwise discussed the matters referenced herein with one or more of SCM’s trading desks, any of which may have accumulated or otherwise taken a position, long or short, in any of the financial instruments discussed in or related to this material. Further, SCM may act as a market maker or principal dealer and may have proprietary interests that differ or conflict with the recipient hereof, in connection with any financial instrument discussed in or related to this material.
This message, including any attachments or links contained herein, is subject to important disclaimers, conditions, and disclosures regarding Electronic Communications, which you can find at https://portfolio-strategy.apsec.com/sancap-disclaimers-and-disclosures.
Important Disclaimers
Copyright © 2026 Santander US Capital Markets LLC and its affiliates (“SCM”). All rights reserved. SCM is a member of FINRA and SIPC. This material is intended for limited distribution to institutions only and is not publicly available. Any unauthorized use or disclosure is prohibited.
In making this material available, SCM (i) is not providing any advice to the recipient, including, without limitation, any advice as to investment, legal, accounting, tax and financial matters, (ii) is not acting as an advisor or fiduciary in respect of the recipient, (iii) is not making any predictions or projections and (iv) intends that any recipient to which SCM has provided this material is an “institutional investor” (as defined under applicable law and regulation, including FINRA Rule 4512 and that this material will not be disseminated, in whole or part, to any third party by the recipient.
The author of this material is an economist, desk strategist or trader. In the preparation of this material, the author may have consulted or otherwise discussed the matters referenced herein with one or more of SCM’s trading desks, any of which may have accumulated or otherwise taken a position, long or short, in any of the financial instruments discussed in or related to this material. Further, SCM or any of its affiliates may act as a market maker or principal dealer and may have proprietary interests that differ or conflict with the recipient hereof, in connection with any financial instrument discussed in or related to this material.
This material (i) has been prepared for information purposes only and does not constitute a solicitation or an offer to buy or sell any securities, related investments or other financial instruments, (ii) is neither research, a “research report” as commonly understood under the securities laws and regulations promulgated thereunder nor the product of a research department, (iii) or parts thereof may have been obtained from various sources, the reliability of which has not been verified and cannot be guaranteed by SCM, (iv) should not be reproduced or disclosed to any other person, without SCM’s prior consent and (v) is not intended for distribution in any jurisdiction in which its distribution would be prohibited.
In connection with this material, SCM (i) makes no representation or warranties as to the appropriateness or reliance for use in any transaction or as to the permissibility or legality of any financial instrument in any jurisdiction, (ii) believes the information in this material to be reliable, has not independently verified such information and makes no representation, express or implied, with regard to the accuracy or completeness of such information, (iii) accepts no responsibility or liability as to any reliance placed, or investment decision made, on the basis of such information by the recipient and (iv) does not undertake, and disclaims any duty to undertake, to update or to revise the information contained in this material.
Unless otherwise stated, the views, opinions, forecasts, valuations, or estimates contained in this material are those solely of the author, as of the date of publication of this material, and are subject to change without notice. The recipient of this material should make an independent evaluation of this information and make such other investigations as the recipient considers necessary (including obtaining independent financial advice), before transacting in any financial market or instrument discussed in or related to this material.
Important disclaimers for clients in the EU and UK
This publication has been prepared by Trading Desk Strategists within the Sales and Trading functions of Santander US Capital Markets LLC (“SanCap”), the US registered broker-dealer of Santander Corporate & Investment Banking. This communication is distributed in the EEA by Banco Santander S.A., a credit institution registered in Spain and authorised and regulated by the Bank of Spain and the CNMV. Any EEA recipient of this communication that would like to affect any transaction in any security or issuer discussed herein should do so with Banco Santander S.A. or any of its affiliates (together “Santander”). This communication has been distributed in the UK by Banco Santander, S.A.’s London branch, authorised by the Bank of Spain and subject to regulatory oversight on certain matters by the Financial Conduct Authority (FCA) and the Prudential Regulation Authority (PRA).
The publication is intended for exclusive use for Professional Clients and Eligible Counterparties as defined by MiFID II and is not intended for use by retail customers or for any persons or entities in any jurisdictions or country where such distribution or use would be contrary to local law or regulation.
This material is not a product of Santander´s Research Team and does not constitute independent investment research. This is a marketing communication and may contain ¨investment recommendations¨ as defined by the Market Abuse Regulation 596/2014 ("MAR"). This publication has not been prepared in accordance with legal requirements designed to promote the independence of research and is not subject to any prohibition on dealing ahead of the dissemination of investment research. The author, date and time of the production of this publication are as indicated herein.
This publication does not constitute investment advice and may not be relied upon to form an investment decision, nor should it be construed as any offer to sell or issue or invitation to purchase, acquire or subscribe for any instruments referred herein. The publication has been prepared in good faith and based on information Santander considers reliable as of the date of publication, but Santander does not guarantee or represent, express or implied, that such information is accurate or complete. All estimates, forecasts and opinions are current as at the date of this publication and are subject to change without notice. Unless otherwise indicated, Santander does not intend to update this publication. The views and commentary in this publication may not be objective or independent of the interests of the Trading and Sales functions of Santander, who may be active participants in the markets, investments or strategies referred to herein and/or may receive compensation from investment banking and non-investment banking services from entities mentioned herein. Santander may trade as principal, make a market or hold positions in instruments (or related derivatives) and/or hold financial interest in entities discussed herein. Santander may provide market commentary or trading strategies to other clients or engage in transactions which may differ from views expressed herein. Santander may have acted upon the contents of this publication prior to you having received it.
This publication is intended for the exclusive use of the recipient and must not be reproduced, redistributed or transmitted, in whole or in part, without Santander’s consent. The recipient agrees to keep confidential at all times information contained herein.


