


By the Numbers
A good year for the low beta managers
Caroline Chen | December 9, 2022
This document is intended for institutional investors and is not subject to all of the independence and disclosure standards applicable to debt research reports prepared for retail investors. This material does not constitute research.
CLO managers have struggled to keep up with the investment performance in the broad loan market this year. But managers with conservative loan portfolios outperformed the loan index in eight out of 11 reporting periods year-to-date, including the most recent one. And these managers have also led their risk-taking peers most of the year, including a margin in the most recent period of nearly 40 bp. This is proving to be a good year for low beta managers.
The Morningstar/LSTA Total Return Index lost 0.37% for the reporting period ending in November after accounting for managers’ reporting dates. The average loan portfolio for managers with five or more actively tracked deals had a beta to the index slightly above 1.02. With that beta, the average portfolio should have posted a loss of 0.38%, but instead managers weighted by assets-under-management lost 0.43%, leaving the average portfolio after adjusting for risk behind the index by 5 bp.
The excess return posted by individual managers ranged from 70 bp at the high end to -143 bp at the low end.
Managers’ performance trailed the index in most reporting periods this year
On an average excess return basis, managers’ loan portfolio performance trailed the broad market in eight out of eleven reporting periods this year, after adjusting for CLO reporting dates and loan portfolio risks (Exhibit 1).
Exhibit 1. Managers’ average loan portfolios have a lackluster performance

Note: Each reporting period includes the most recent three months. For example, reporting period ending in Nov-22 includes the average manager performance in the past three months ending on or before November 21, 2022. The data shows the average excess return relative to the Morningstar/LSTA Total Return Index for 84 managers with five or more active deals.
Source: Intex, Markit, Amherst Pierpont Securities
Managers’ performance has shown greater variability
Managers’ excess return performance has shown an increasing level of dispersion this year. For example, the excess return difference between the 75th percentile of manager performance and the 25th percentile at the beginning of the year was 17 bp but rose in the most recent period to 55 bp (Exhibit 2).
Exhibit 2. Managers’ excess returns have shown a trend of rising variability

Note: Each reporting period includes the most recent three months. For example, reporting period ending in Nov-22 includes the average manager performance in the past three months ending on or before November 21, 2022.
Source: Intex, Markit, Amherst Pierpont Securities.
Managers’ risk positioning set their performance apart
Managers’ risk positioning, as measured by the beta in the APS manager model, ranged from 1.22 at the high end to 0.88 at the low end. The group of risk-averse managers, those having a beta lower than 1.00, posted positive excess returns in eight of the past 11 reporting periods. High beta managers, those having a beta greater than or equal to 1.00, only had positive excess returns in three out of the same eleven reporting periods. In general, low-beta managers have led their high-beta peers in nine reporting periods year-to-date (Exhibit 3). The performance difference between low beta and high-beta managers has also grown. Weighted by managers’ CLO AUM, the excess returns of the low beta managers led their high beta peers by 38 bp for the reporting period ending in November. By contrast, the margin was only 8 bp at the beginning of the year.
Exhibit 3. Low beta managers were better performed in most of the periods

Note: Each reporting period includes the most recent three months. For example, reporting period ending in Nov-22 includes the average manager performance in the past three months ending on or before November 21, 2022. The high beta group includes 58 managers whose beta is over or equal to 1 with a median of 1.05. The low beta group includes 26 managers whose beta is no more than 1 with a median of 0.98.
Source: Intex, Markit, Amherst Pierpont Securities.
Loan prices continue to contribute to the managers’ positive excess return
The correlation between loan prices and managers’ excess returns, although weakened, remains the strongest among all loan attributes (Exhibit 4). Higher loan prices typically signal lower credit risk, and low beta managers generally have higher loan prices in their CLO loan portfolios.
Exhibit 4. Loan prices remain the most correlated to managers’ excess return

Note: Data shows the correlation of each measure, calculated across each manager’s outstanding deals, with excess return or alpha as measured for 84 managers through November.
Source: Intex, Markit, Amherst Pierpont Securities.
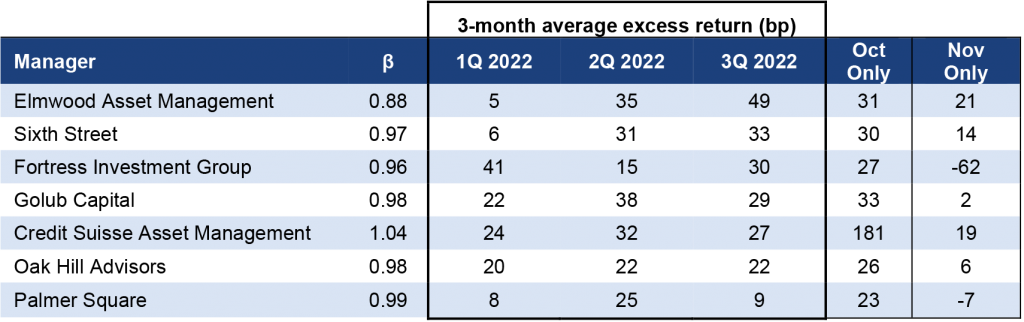
Few managers posted positive excess returns on a quarterly basis
The median information ratio of CLO deals tracked by the APS manager model implies most managers have some consistency in long-run performance, but a few managers delivered positive excess returns in each of the past three quarters. Except for CSAM, all managers are low beta managers (Exhibit 5).
Exhibit 5. Most managers who outperformed in each quarter have low beta
Source: Intex, Markit, Amherst Pierpont Securities
For the three months ending in November, Generate Advisors, Elmwood, Marathon, AIG, and Sixth Street led all managers with the highest excess return. A list of all managers and their level of excess return is below (Exhibit 6). A complete list of managers and their returns is here.
Exhibit 6. CLO manager performance for the three months ending November
![]()
Note: Performance for managers with five or more deals issued since January 1, 2011, and tracked by APS. Performance attribution starts with calculated total return on the leveraged loan portfolio held in each CLO for the 3-month reporting period ending on the indicated date. CLOs, even with a single manager platform, may vary in reporting period. The analysis matches performance in each period to performance over the identical period in the S&P/LSTA Leveraged Loan Index. Where a deal has at least 18 months of performance history since pricing and no apparent errors in cash flow data, the analysis calculates a deal beta. The deal beta is multiplied by the index return to predict deal return attributable to broad market performance. Where no beta can be calculated, the analysis uses the average beta across manager deals weighted by the average deal principal balance over time. Any difference between performance attributable to beta and actual performance is attributed to manager alpha.
Source: Intex, Markit, Amherst Pierpont Securities.
A link to Amherst Pierpont’s latest CLO manager bubble chart (Exhibit 6) and to data on more than 140 managers and more than 1,000 active deals is here.
Exhibit 7. Amherst Pierpont CLO manager bubble chart

Source: Intex, Markit, Amherst Pierpont Securities