


By the Numbers
Out-of-consensus calls on 2023 agency MBS
Brian Landy, CFA | November 18, 2022
This material is a Marketing Communication and does not constitute Independent Investment Research.
The agency mortgage-backed securities market looks likely to face another year of relatively heavy supply and light demand, keeping option-adjusted spreads historically wide and likely volatile. But conditions should nevertheless improve for specified pool trading. Dollar rolls look less likely to run special, and a higher conforming loan limit should make originators more willing to create specified pools for small pay-ups. There is still considerable uncertainty regarding the correct level of turnover prepayment speeds, which affects valuing most of the market. And a policy focus on affordable lending and a healthy FHA insurance fund should lead to cuts in FHA insurance premiums next year.
This points to four calls outside the consensus on the 2023 agency MBS market:
- Heavy supply and light demand keeps spreads wide
- Turnover settles at historical averages
- Specified pooling gets a boost
- FHA insurance premiums get lowered
Heavy supply and light demand keeps spreads wide
Mortgage option-adjusted spreads should continue to feel pressure next year due to a combination of heavy supply and uncertain demand. Nominal spreads will depend on volatility, of course, but the focus here is on spreads net of option costs. The net supply of new mortgages should stay above pre-pandemic levels despite a slowing housing market. And runoff from the Fed’s MBS portfolio adds to the flow of mortgage-backed securities that private investors will need to absorb. But banks don’t appear likely to grow their MBS holdings, and may keep selling, which leaves uncertainty about who will buy mortgages and the spreads needed to boost demand.
The net supply of mortgage-backed securities is closely related to home purchase activity. Rate and term refinances replace a loan with a new loan of the same size, so do not add to the balance of outstanding MBS. But home sales do contribute to supply. New homes add to the housing stock, assuming new construction exceeds the rate at which old homes become obsolete, and many of those sales are financed with loans. Existing home sales also contribute to net supply since the new loan is typically larger than the loan that is paid off.
Two aspects of home sales influence net supply—the number of home sales and the size of a new loan. Both factors contributed to historic net agency MBS issuance throughout the pandemic. Many people chose to move and the price of homes jumped considerably. The average size of a Fannie Mae and Freddie Mac home purchase loan grew from $265,000 in 2019 to $340,000 in 2022. That means each new home sold contributes $75,000 more to net supply than before the pandemic, a 28% increase.
The contribution of existing home sales to net supply depends on the difference between the loan being bought and the loan being sold. That only increased around $40,000 from 2019 to 2022. Therefore, the contribution of existing home sales to net supply increased 87.5%, and the number of existing homes sold is close to 10x the number of new homes sold. This loan size difference has a large effect on net supply.
Amherst Pierpont’s baseline view is that home prices will level off for the next year. This means that the loan size contribution of new and existing home sales to net supply will remain high and keep net supply above 2019 levels even though home sales are forecast to fall below 2019. Using Fannie Mae’s and the MBA’s home sales forecasts suggests that next year net supply will average $25 billion or $35 billion per month, respectively (Exhibit 1). Estimating $30 billion per month, compared to an average $20 billion per month in 2019, seems reasonable.
Exhibit 1: Agency MBS net supply should average $30 billion per month.
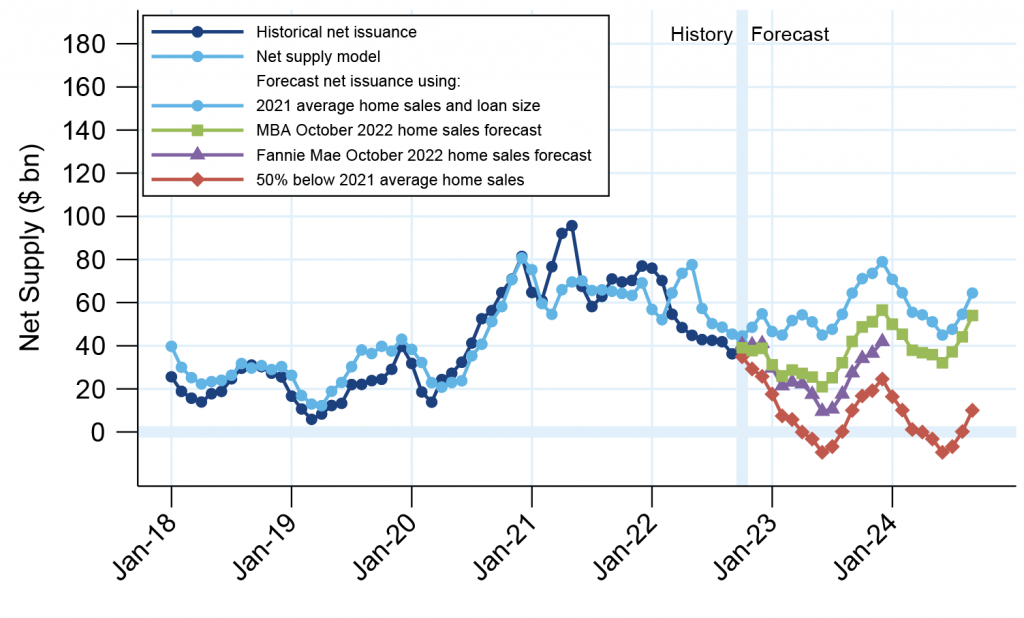
Source: Fannie Mae, Freddie Mac, Ginnie Mae, MBA, Amherst Pierpont Securities.
The Fed MBS portfolio is also larger than before the pandemic, so will contribute more supply from runoff compared to prior rounds of quantitative tightening. For example, the portfolio prepaid 7.6 CPR in January 2019 and 7.4 CPR in September 2022, yet paydowns were only $14.8 billion in January 2019 compared to $24.1 bn in September 2022. And banks reduced mortgage holdings by $163 billion in the first half of the year, which could add to supply next year if that trend continues.
Determining which investors are likely to add MBS next year starts by looking at the current holders of MBS (Exhibit 2). Various depository institutions top the list, owning $3.2 trillion at the end of June 2022. The Fed follows closely behind with $2.7 trillion at that time, although has fallen slightly since then from portfolio runoff. Foreign investors are third, owning $1.17 trillion. Those three investors combined own 82.5% of all agency mortgage-backed securities. However, banks have been shedding MBS this year, and own a larger share of MBS compared to the three years before the pandemic. Banks currently own 37.5% of MBS but typically owned about 30%, so may keep shrinking holdings next year. The Fed’s MBS portfolio should shrink roughly $20 billion a month next year unless interest rates fall a lot.
Exhibit 2: MBS holdings by investor type
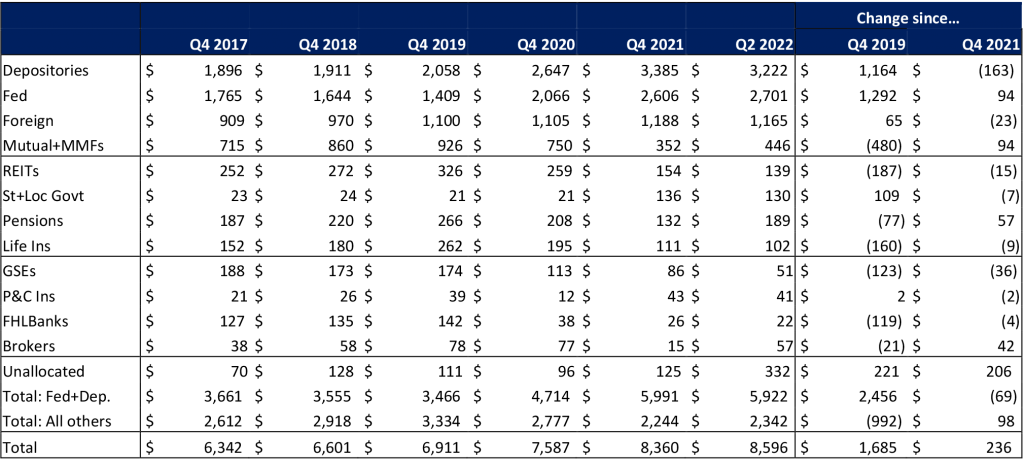
Source: Inside Mortgage Finance, Amherst Pierpont Securities.
The investors with the biggest capacity to add MBS are foreign investors and mutual funds. However, foreign investors own more MBS than before the pandemic, although that is a smaller share of outstanding securities than before. So their appetite to add mortgages might be limited. Mutual funds went underweight MBS during the pandemic and started adding back this year but can weigh mortgage returns against other asset classes so are demanding much wider spreads. Other holders are relatively small, although perhaps wide spreads will entice some back into the market. REITs, life insurance companies, and FHLBanks currently own less MBS than before the pandemic.
Altogether supply could exceed $900 billion next year—if Fed runoff totals $240 billion, banks unload another $360 billion, and net supply totals $360 billion. That almost matches the $992 billion reduction in holdings by all market participants other than banks and the Fed from the end of 2019 to the end of 2021. It may be a tall order to expect the combination of money managers, foreign investors, REITs, insurance companies, FHLBanks, and other smaller players to expand their MBS holdings by this amount. For most of the history of the mortgage market either the Fed or GSEs were large owners of mortgage-backed securities, but none of these entities should be buyers next year. That should generally keep the pressure towards wider spreads.
Spread volatility is likely to be higher than in the past, given the lack of a backstop buyer and ongoing concern that the Fed might start to sell its holdings. But the Fed is unlikely to sell MBS if it feels doing so would hurt its ability to meet the Fed’s inflation or employment mandates.
Agency MBS are the largest source of mortgage financing, but not the only source. So net supply can also be influenced by loans that refinance from an agency mortgage into a mortgage that is placed in a non-agency security or held on a bank’s balance sheet. Or the opposite can happen. It is likely that agency execution will outperform non-agency in a weak economy. My colleague Stephen Stanley thinks a recession is more likely to occur in 2024 than 2023, so that may not be a factor next year. But expect that agency supply could increase if the economy takes a turn for the worse.
Turnover settles at historical averages
Many market participants may be expecting a large drop in home prices, but that may be contingent on a recession and uptick in unemployment. A period of flat prices seems more likely. And growth should soon recover to a typical long-run level of 3% to 5% per year. A persistent shortage of housing and slow pace of new construction should support modest home price appreciation, although there is likely to be significant geographic variation.
High levels of home equity and a positive, albeit modest, outlook for home price appreciation should put overall turnover speeds at roughly the long-term average of about 6.5 CPR to 7.0 CPR (Exhibit 3). Speeds were slower following the 2008 financial crisis, roughly 5 CPR, but many borrowers had negative equity in their homes. That makes it difficult to move. Otherwise, borrowers have many reasons that could force a move—marriage, divorce, having kids, and so on. Having home equity allows that to happen. Speeds were also very slow for a short period in late 1994, but those came during the winter months when turnover is always slow. And the capital gains tax treatment of home sales was changed in 1997; prior to that capital gains taxes were perceived as a drag on home sales. Lock-in may pull speeds slower for a time, but the effect is likely to fade as unavoidable reasons to move accumulate.
Exhibit 3: Turnover averaged 6 CPR to 7 CPR leading up to the pandemic
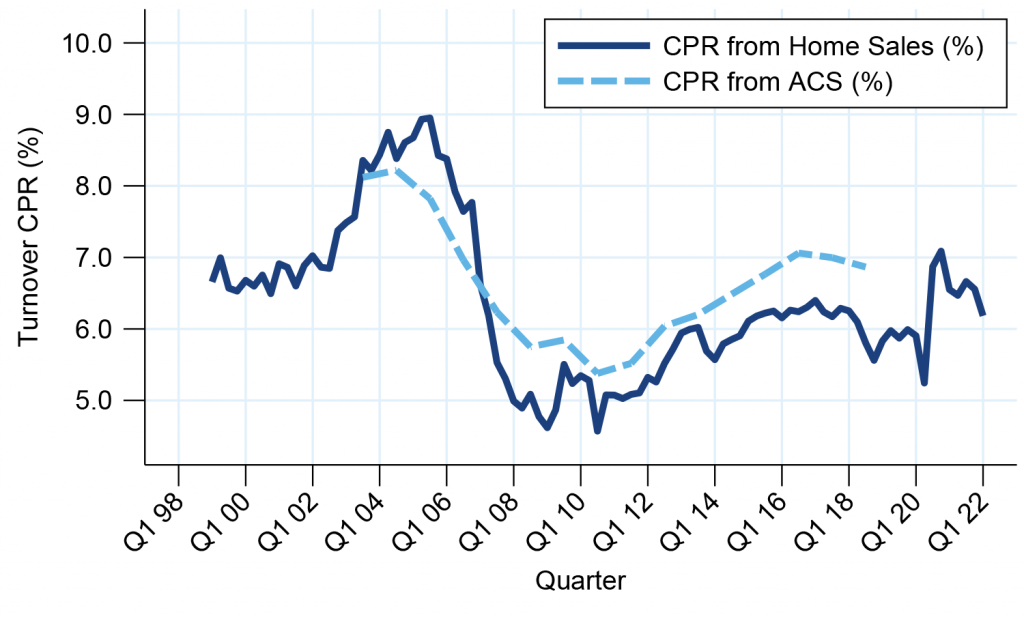
“CPR from Home Sales” estimated using new and existing home sales and size of the outstanding housing stock. “CPR from ACS” estimated using mobility data collected by the American Community Survey.
Source: US Census Bureau American Community Survey, NAR, Amherst Pierpont Securities.
Although average turnover speeds are unlikely to fall to the levels of late 1994 and post-2008, speeds should have large seasonal swings throughout the year. Turnover in the summer could be roughly 80% higher than turnover in the winter solely due to seasonal changes. So low prints like those seen in late 1994 and early 1995 are possible in the upcoming winter month but should not be representative of year-round turnover.
Investors also need to pay attention to geographic differences since some locations will have more robust home price appreciation than others. Even if national HPA is flat, some locations should fall. Small speed differences have a large effect on mortgage-backed securities’ value when bonds are priced at a discount to par, and geographic differences can be responsible for large turnover differences. It might be hard to develop conviction about the prospects for a given state, but it will ultimately make a difference. One approach might be to assemble pools of smaller states that are expected to have positive HPA but don’t command a pay-up. Selecting several states provides diversification in case one does not meet expectations.
Cash-out refinancing also contributes to discount prepayment speeds. Many borrowers are no longer using cash-outs because it means giving up their current loan’s low rate. But some borrowers may need the cash, perhaps to avoid credit card interest that may have rates exceeding 30%. These borrowers may not be able to borrow with a second lien or home equity line-of-credit, leaving the cash-out as the only available option. This seems to be borne out in the data—conventional cash-out credit scores have fallen 20 points since the start of the year, and FHA cash-out volume has held steady.
Cash-outs are still responsible for roughly 15% to 20% of all prepayments and are one reason to prefer Ginnie Mae pools of FHA borrowers and pools of low-credit borrowers.
On the other hand, newer Ginnie Mae pools may face extension risk from loan assumptions. A homebuyer can take over the payments of an existing FHA loan from the seller rather than pay off the loan and take out a new loan. This is helpful when the current loan’s note rate is below the market rate. However, if there has been a lot of appreciation the buyer will need to take out a second lien, making the loan assumption difficult to execute. Loan assumptions work best when home price appreciation is nearly flat, which should be true for many loans originated this year. But seasoned loans with home equity are unlikely to be assumed. VA loans also allow for assumptions, but they are unlikely to happen unless the buyer is also eligible for a VA loan. Otherwise the seller cannot use VA financing until the existing loan is prepaid.
Specified pooling gets a boost
The conforming loan-limit is poised to increase roughly 10% in 2023. The increase is determined by home price appreciation from September 2021 to September 2022, using the FHFA’s home price indices. This was codified in law in 2008 so presumably the GSEs and FHFA have no authority to change limits differently. This means that fewer loans will be subject to de minimis pooling requirement. But jumbo conforming origination has already fallen more than origination of smaller loans, which is typical in a turnover environment. So most pools are not reaching the 10% de minims limit and few jumbo conforming pools are being made.
The higher limit should be a positive development for creating specified pools. In past years originators could use conforming loans to increase the amount of jumbo loans deliverable into conforming pools. Creating a specified pool would result in greater issuance of jumbo conforming pools that trade below the TBA price.
For example, it should be easier to assemble pools of loans backed by states that don’t currently command a pay-up for prepayment protection but could prepay faster in a discount environment. Or to build Ginnie Mae pools backed by only FHA borrowers.
Heavy Fed and bank buying throughout 2020 and 2021 kept dollar rolls at special levels, which lowers demand for specified pools. Investors that can dollar roll often find the special financing to be more valuable than the prepayment protection from specific pools. But the supply and demand outlook for next year suggest that special financing should be the exception, not the norm.
Pools backed by low-credit borrowers also look interesting, especially if there is some uncertainty about the economy and timing of a recession. If there is no recession in 2023 and the housing market stabilizes at a normal level then low-credit borrowers typically turnover faster and will be more likely to do cash-out refinances. But if the economy does weaken more than expected then these borrowers are more likely to offer extensions protection through defaults and buyouts.
FHA insurance premiums get lowered
Continued capital growth in the FHA’s insurance fund is likely to allow the FHA to lower insurance premiums next year. The fund’s capital ratio jumped to 11.11% as of the end of September, up from 8.03% one year earlier. That includes performance from the HECM portfolio, which is small but more sensitive to home price appreciation. Excluding HECMs, the capital ratio increased to 10.47% from 7.99%. Much of the improvement is attributed to home price appreciation, which lowers the probability of loss and loss severity.
The report mentions that the fund no longer needs to bolster reserves to guard against future losses. However, the report cautions that slow home price appreciation means that fund capital is unlikely to increase much next year and may even fall. A stress scenario that repeats the events of the 2008 financial crisis is projected to leave the fund with a 6.31% capital ratio, well above the statutory minimum. The FHA needed a capital infusion following the financial crisis, so is much better prepared for a downturn than in 2007. The FHA likely thinks that it no longer needs to charge 85 bp annually. However, the 55 bp annual premium charged prior to 2008 proved insufficient.
Therefore, a cut of around 15 bp seems most likely. That level may provide modest capital growth in a good economy and makes it unlikely that the FHA would need to raise insurance premiums to build capital after a downturn. Lower premiums will not have much effect on most Ginnie Mae MBS, which are well out-of-the-money to refinance. But refinancings could increase on loans originated in 2022.