


The Big Idea
The bellwether of credit rings lightly
Steven Abrahams | November 4, 2022
This material is a Marketing Communication and does not constitute Independent Investment Research.
With spreads in most forms of credit wider on the year and still vulnerable to slowing growth or outright recession, the market in leveraged loans is playing the role of bellwether for actual credit deterioration. Most forms of corporate and consumer credit get some protection from higher rates for now thanks to low fixed-rate debt with long maturities issued in recent years. But not so for leveraged loans. And the bell is starting to ring lightly in the loan market.
Pressure from a rising cost of floating-rate funds
Almost the entire $1.4 trillion broadly syndicated leveraged loan market is indexed to 1- or 3-month LIBOR or SOFR and has seen interest expense jump this year (Exhibit 1). The total cost of a new institutional loan finished last year at 4.08% but closed September at 7.89%–a 93% increase in the cost of funds. Roughly two-thirds of the higher cost comes from the higher index and the rest from wider spreads. And these costs only partially reflect the 75 bp Fed hike in late September and none of the 75 bp hike of November. They also do not anticipate the added 130 bp priced into fed funds futures over the next six months.
Exhibit 1: The cost of a new leveraged loan Jan-Sep: from 4.08% to 7.89%
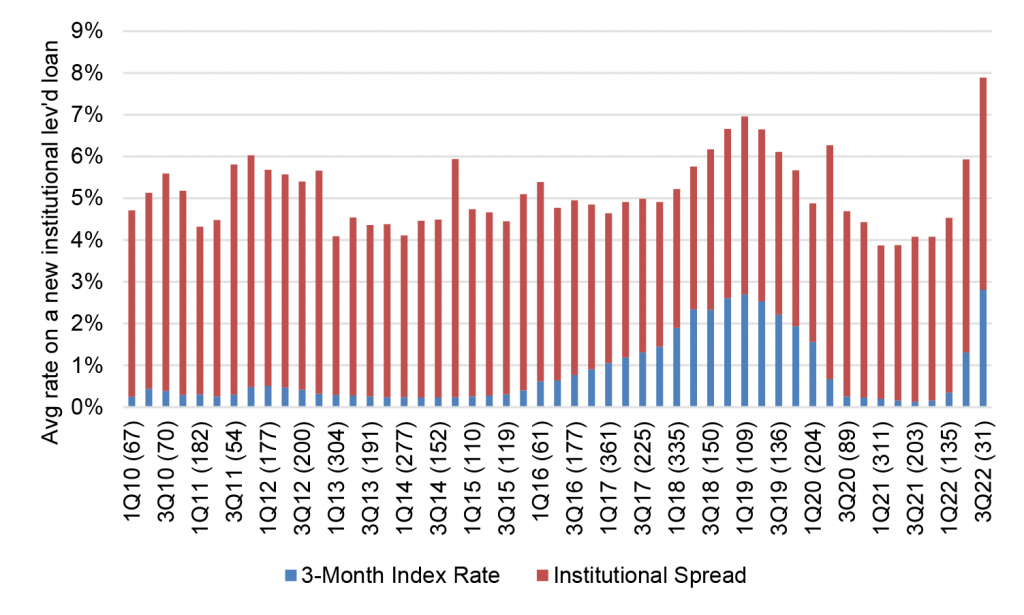
Note: Data shows quarterly average and number of observations of instutional leveraged loans. LIBOR up to 2022, SOFR after.
Source: PitchBook LCD, Amherst Pierpont Securities.
Not all loans bear the costs of new ones, of course. But even borrowers with interest margins locked in before the Fed started tightening—margins closer to 3.70% than to the recent 5.08%—would see interest expense go up by an average 69% based on the rising index along.
Limited room to absorb rising interest expense
The average balance sheet in the leveraged loan market does not have a lot of room to absorb higher interest costs. At the end of 2021, the average leveraged loan sat on a balance sheet with $4.10 of earnings for every $1 of interest expense (Exhibit 2). By the end of September, that had dropped to $3.30 of earnings for every $1 of interest expense. The drop should not come as a surprise since Fed hiking from 2004 to 2006 and again from 2017 into 2019 both cut the cash flow multiples of highly leveraged borrowers.
Exhibit 2: Declining cash flow multiples for on highly leveraged loans
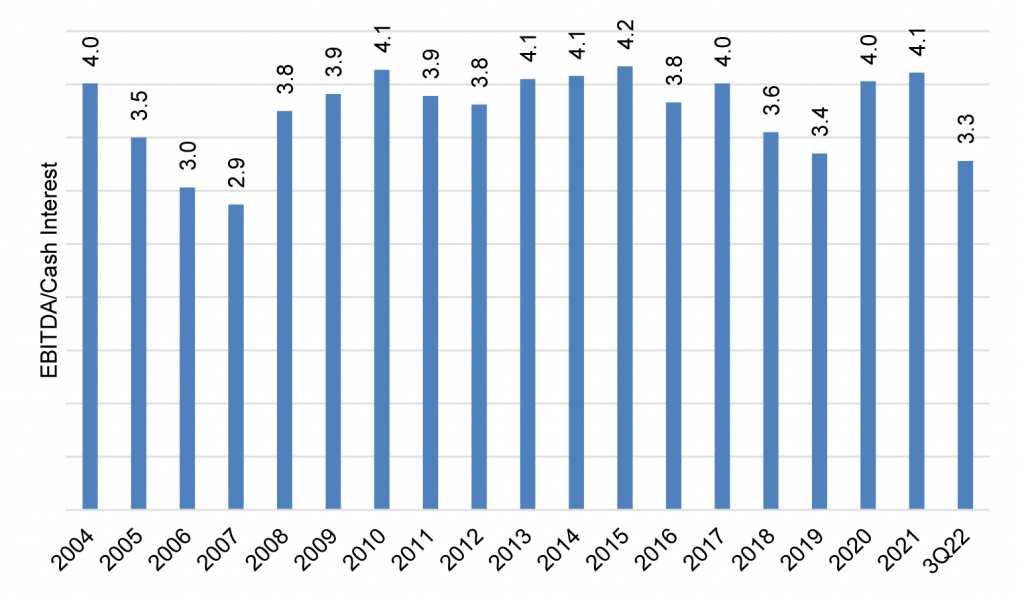
Source: PitchBook LCD, Amherst Pierpont Securities.
These multiples look very likely to drop even below the marks set before the GFC based on interest expense alone. Rising earnings could offset interest expense, but as Fed Chair Powell noted in his press conference after the November FOMC, “reducing inflation is likely to require a sustained period of below-trend growth.” The deck looks stacked against a boom in earnings that will offset the cost of rising rates.
Other signs of tighter credit for leveraged borrowers
The volume of issuance in leveraged loans and high yield debt also point to tighter credit for leveraged borrowers that might need to refinance maturing debt. Leveraged loan issuance finished September down 57% from the same period last year, and high yield issuance finished October down 79%. Wider spreads and lower volume are the signature of a drop in credit supply.
Tighter credit looks unlikely to pinch the leveraged loan market too hard in the next few years. Only 1% of the outstanding leveraged loan market matures next year and 7% the year after (Exhibit 3). Only in 2025 do maturities accelerate. Of course, refinancings could get complicated if slow growth turns into recession in 2024.
Exhibit 3: Loan maturities give the market some breathing room
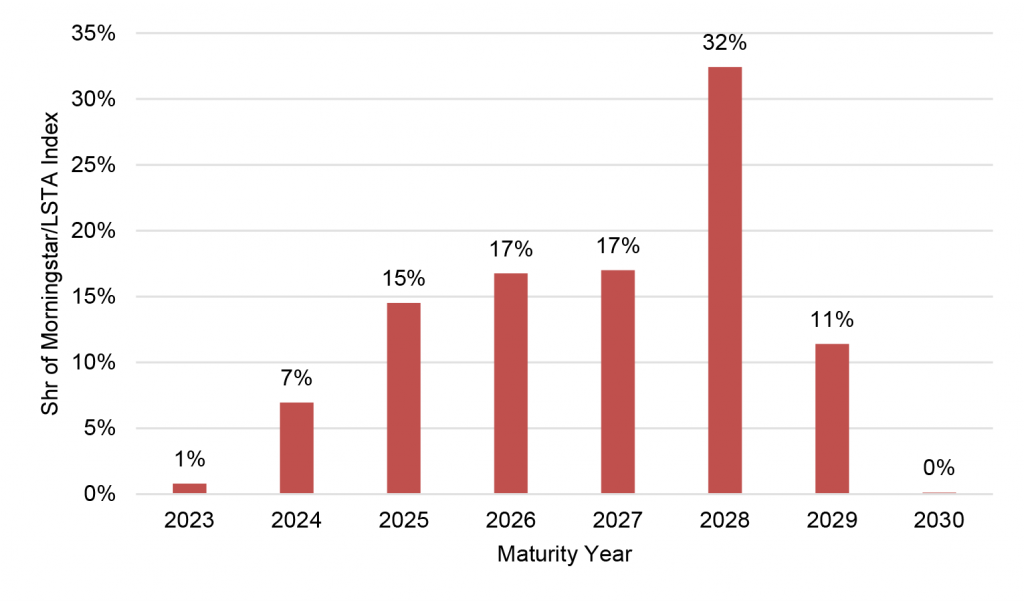
Source: PitchBook LCD, Amherst Pierpont Securities.
Credit results so far
Although it is early, leveraged loan credit is stronger than historical averages but starting to weaken. The rolling 12-month loan default rate started the year at 29 bp and has moved through October to 83 bp (Exhibit 4). It seems likely to normalize around 2% absent recession and double that level to 4% with recession.
Exhibit 4: Leveraged loan defaults have started to pick up
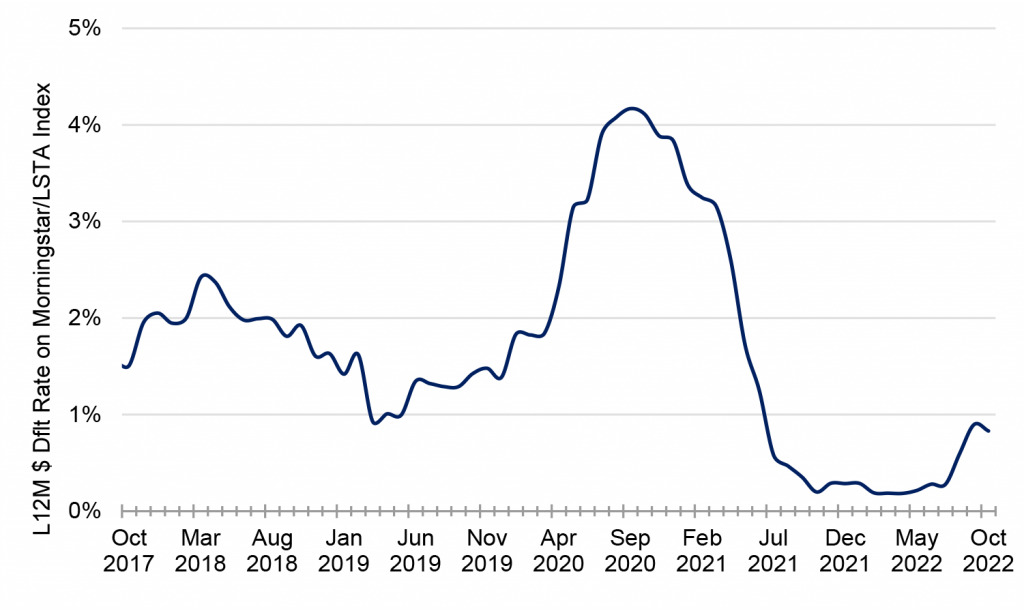
Source: PitchBook LCD, Amherst Pierpont Securities.
The traded loan market has also started to anticipate credit stress with the share of loans trading at spreads of 1,000 bp or more climbing through October to 7.11%–the highest point in the last five years outside the onset of pandemic and its immediate aftermath (Exhibit 5). The pricing almost certainly anticipates downgrades and defaults. Recession should drive distressed share higher.
Exhibit 5: A rising share of loan trading at distressed spreads
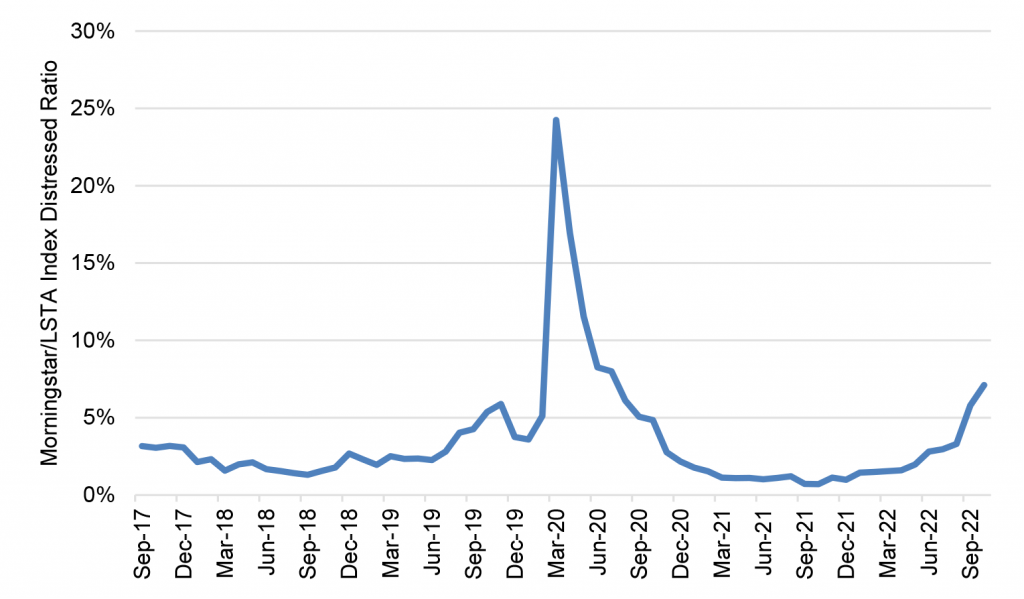
Note: Distressed ratio is the share of index with spreads greater than 1,000 bp.
Source: PitchBook LCD, Amherst Pierpont Securities
The credit bell is ringing lightly in the leveraged loan market so far. Interest expense is almost certain to rise further, earnings are almost certain to fall as growth slows, defaults are likely to rise. The ratio of downgrades to upgrades has started to edge up lately and should go substantially higher next year. For leveraged loan investors, all of this makes for a challenging market. For CLO investors, the credit of leveraged loans will get reflected in CLO spreads, ratings and possibly in shifting cash flows for deals that fail overcollateralization and interest coverage tests. However, nothing at this point signals unmanageable stress in leveraged loans. And spreads on leveraged loans and CLOs offer substantial compensation for these risks.
Other corners of credit less exposed and fundamentally stronger
The interest rate risk squeezing the highly leveraged balance sheets of borrowers in leveraged loans does not apply to most other parts of the corporate or consumer market. The duration of assets in the investment grade market is running around 7.0 years. The duration of high yield debt is running around 4.5 years. The duration of loans backing agency MBS is running around 6.0 years. All of these markets are largely protected for now from the Fed’s higher rates.
Absent the immediate pressure of higher rates, the likelihood of significantly weaker credit outside of leveraged loans is low unless something—a deep and prolonged recession—erodes the income and liquid reserves on these balance sheets. And with slowing growth and possible recession largely in the hands of the Fed, that seems unlikely.
* * *
The view in rates
OIS forward rates imply fed funds will peak just above 5% in June and largely hold through the end of 2023. That starts to price in some of Fed Chair Powell’s hawkish notes after the November FOMC. But forecasting inflation and other elements of the economy has become extremely difficult in the aftermath of pandemic, as the Fed often acknowledges. There is still risk of repricing the Fed path higher.
Fed RRP balances closed Friday at $2.23 trillion, around the average since June. The RRP rates beats short Treasury bills. So, money market funds have little alternative but to put proceeds into RRP.
Settings on 3-month LIBOR have closed Friday at 453 bp, higher by 12 bp on the week. Setting on 3-month term SOFR closed Friday at 421 bp, also higher by 12 bp. The spread between 3-month SOFR and LIBOR has widened from 10 bp in early October to 34 bp lately, likely reflecting the higher cost of bank borrowing over yearend.
Further out the curve, the 2-year note closed Friday at 4.66%, roughly fair value based on Fed dots through 2024 and Powell’s comments after the November meeting. The 10-year note closed well above fundamental fair value at 4.16%, so the higher yield has to get chalked up to a market seeing or expecting supply to overwhelm demand. It is shaping up to be a long and volatile winter for the rates market.
The Treasury yield curve has finished its most recent session with 2s10s at -50 bp, flatter by 10 bp on the week. The 5s30s finished the most recent session at -8 bp, flatter by 4 bp on the week. The 2s10s curve looks likely to invert by around 70 bp shortly before Fed tightening comes to an end. That is a trade for some time next year.
Breakeven 10-year inflation finished the week at 248 bp, down by 2 bp from a week before. The 10-year real rate finished the week at 168 bp, up by 16 bp on the week.
The view in spreads
Volatility should continue while the Fed’s path stays in flux. It is becoming increasingly clear that Fed emphasis on data—and the uncertainty of the data itself—has created much more uncertainty than the benchmark tightening cycle of 2004 through 2006. That makes news on growth, inflation, unemployment and policy much more important in this market. And the higher informational content adds to realized volatility. Both MBS and credit have widened steadily since mid-August. Nominal par 30-year MBS spreads to the blend of 5- and 10-year Treasury yields finished the most recent session at 168 bp, wider by 4 bp on the week. Par 30-year MBS OAS finished the week at 61 bp, wider by 4 bp on the week. Investment grade cash credit spreads have finished the week at 177 bp over the SOFR curve, tighter by 7 bp.
The view in credit
Most corporate and consumer balance sheets look relatively well protected against the likely impact of Fed tightening. Fixed-rate funding largely blunts the impact of higher rates, and health stocks of cash and liquid assets allow these balance sheets to absorb a moderate squeeze on income. A recent New York Fed study argues inflation generally helps companies lift gross margins, although airlines and leisure may have an easier time passing through costs than healthcare, retail and restaurants. But in leveraged loans, a higher real cost of funds would start to eat away at highly leveraged balance sheets with weak or volatile revenues. The leveraged loan market is the bellwether to watch for broader corporate and consumer credit.