The Long and Short
Alleghany still looks attractive
This material is a Marketing Communication and does not constitute Independent Investment Research.
Despite its recent acquisition by Berkshire Hathaway, Alleghany still trades at an attractive discount to its new parent. The closing of the deal on October 19 helped compress spreads between the debt of the parent and the new subsidiary. But the intermediate Alleghany notes still offer generous spread even after considering differences in dollar price. Berkshire will likely consider Alleghany as a core business and provide both implicit and explicit levels of support. That makes the Alleghany notes even more attractive.
Berkshire Hathaway (BRK: Aa2/AA/A+) initiated its acquisition of Alleghany (Y: A1/AA) in March of this year, something highlighted in May in Amherst Pierpont’s M&A Playbook. At that point, the discount was closer to 45 bp for a trade out of BRK 2030-2032 notes to the Y 2030s. The Y 3.625% 2030s still trade roughly 30 bp wide to the cluster of BRK maturities in that part of the curve, an attractive level.
Exhibit 1. BRK curve vs newly acquired Y debt issues
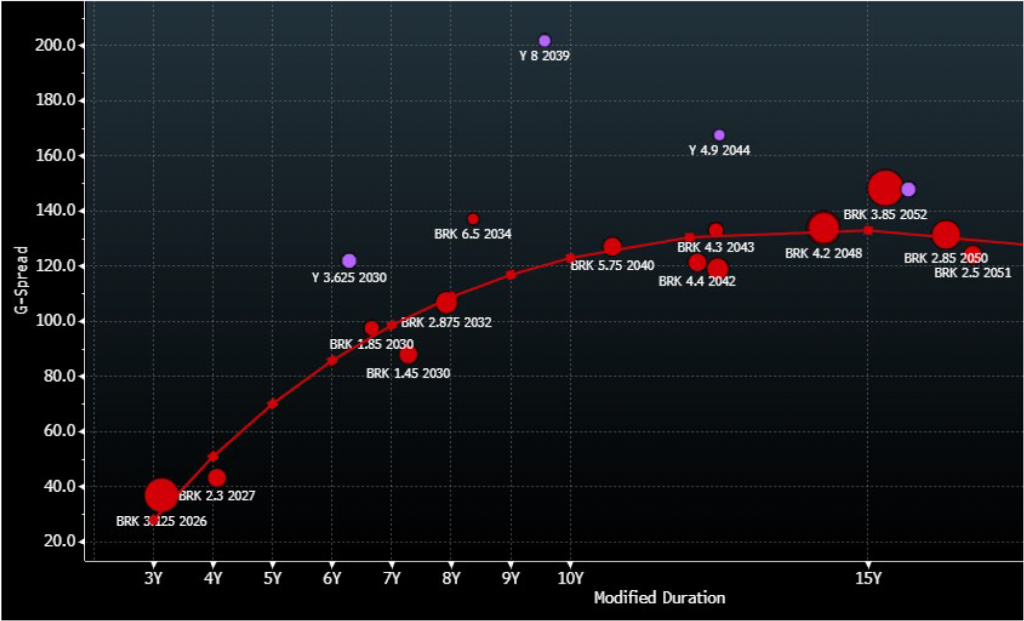
Source: Amherst Pierpont, Bloomberg/TRACE Indications
Y 3.625% 05/15/30 @ +133/10YR; G+123; 5.51%; $88.52
Issuer: Alleghany Corp (Y)
CUSIP: 017175AE0
Amount outstanding: $500 million (Index-eligible)
Senior Debt Rating: A1/AA
Berkshire Hathaway Senior Debt Rating: Aa2/AA/A+
Global Deal
The $11.6 billion purchase of Y is BRK’s first big foray into the insurance space in a long time and the conglomerate’s largest scale acquisition in roughly six years. The original terms of the deal were accepted by both sides and a brief “go shop” period did not yield any competing offers. There were no apparent regulatory concerns raised during the approval process as well. BRK is legally assuming the existing debt of Y, but did not provide an explicit guarantee, nor did they dissolve the legacy debt ticker of the new operating subsidiary. BRK has a lengthy and storied track record of demonstrating financial support for the operating entities that fall under its conglomerate umbrella.
On the closing of the transaction, S&P equalized the ratings of Alleghany with those of the parent, raising the senior unsecured rating to ‘AA’ from ‘BBB+’ and assigning a stable outlook. The insurance financial strength (IFS) ratings of the operating subsidiaries at Y were also raised to ‘AA+’ from ‘A+’. S&P views Y as a core operation of BRK’s insurance group. In addition to the implicit support that the parent is likely to provide, the rating agency also highlights the explicit support that comes in the form of internal reinsurance agreements. S&P also believes that the existing external reinsurance agreements of Y could be replaced with additional internal support from National Indemnity or other group affiliates in the future.
Moody’s took a slightly different approach, raising the senior debt rating on Y to ‘A1’ from ‘Baa1’, and taking the insurance financial strength rating of TransRe to ‘Aa2’ from ‘A1’ and the IFS ratings of RSUI Indemnity and Landmark American Insurance to ‘Aa3’ from ‘A2’. Stable outlooks were assigned to all the ratings. Moody’s also acknowledged the high likelihood of both implicit and explicit support from the parent and highlighted that the IFS ratings of the insurance subsidiaries incorporate two notches of uplift from their standalone rating profiles. Both agencies appeared to compress the typical notching between the parent and IFS ratings (typically 3 notches) to reflect the broad support provided by Berkshire. Fitch does not rate standalone Alleghany.
Standalone Alleghany is a hybrid reinsurance and P&C operator, traditionally seen as a close operating comp to XL Group (XL: A3/BBB+/A-) and Arch Capital (ACGL: Baa1/A-/BBB+). Alleghany significantly expanded its reinsurance operations through the 2012 purchase of Transatlantic Holdings (TransRe) for $3.8 billion. Reinsurance and Excess & Surplus (E&S) are its two core business lines. The company’s risk profile is similar to that of a more traditional P&C operator with exposure to earnings volatility as a result of catastrophe losses. They are extremely well capitalized and a strong operator in their core markets. They had some modest Covid-19 related losses in 2020, but those exposures remain manageable.
Y has a very solid liquidity profile, which it helped improve through debt issuance in recent years – as proceeds were utilized to help term out its maturity profile. The Company has $942 million in cash and equivalents on the balance sheet as of the last quarter it reported standalone results, plus an additional $300 million available on their revolving credit facility through 2026. The next public debt maturity is not until 2030. Prior to that, there is just a small $85 million in loans outstanding in 2023, plus another $325 million in loans due in 2026. The remainder of Y’s debt maturities are in the long-end of the curve.
This material is intended only for institutional investors and does not carry all of the independence and disclosure standards of retail debt research reports. In the preparation of this material, the author may have consulted or otherwise discussed the matters referenced herein with one or more of SCM’s trading desks, any of which may have accumulated or otherwise taken a position, long or short, in any of the financial instruments discussed in or related to this material. Further, SCM may act as a market maker or principal dealer and may have proprietary interests that differ or conflict with the recipient hereof, in connection with any financial instrument discussed in or related to this material.
This message, including any attachments or links contained herein, is subject to important disclaimers, conditions, and disclosures regarding Electronic Communications, which you can find at https://portfolio-strategy.apsec.com/sancap-disclaimers-and-disclosures.
Important Disclaimers
Copyright © 2026 Santander US Capital Markets LLC and its affiliates (“SCM”). All rights reserved. SCM is a member of FINRA and SIPC. This material is intended for limited distribution to institutions only and is not publicly available. Any unauthorized use or disclosure is prohibited.
In making this material available, SCM (i) is not providing any advice to the recipient, including, without limitation, any advice as to investment, legal, accounting, tax and financial matters, (ii) is not acting as an advisor or fiduciary in respect of the recipient, (iii) is not making any predictions or projections and (iv) intends that any recipient to which SCM has provided this material is an “institutional investor” (as defined under applicable law and regulation, including FINRA Rule 4512 and that this material will not be disseminated, in whole or part, to any third party by the recipient.
The author of this material is an economist, desk strategist or trader. In the preparation of this material, the author may have consulted or otherwise discussed the matters referenced herein with one or more of SCM’s trading desks, any of which may have accumulated or otherwise taken a position, long or short, in any of the financial instruments discussed in or related to this material. Further, SCM or any of its affiliates may act as a market maker or principal dealer and may have proprietary interests that differ or conflict with the recipient hereof, in connection with any financial instrument discussed in or related to this material.
This material (i) has been prepared for information purposes only and does not constitute a solicitation or an offer to buy or sell any securities, related investments or other financial instruments, (ii) is neither research, a “research report” as commonly understood under the securities laws and regulations promulgated thereunder nor the product of a research department, (iii) or parts thereof may have been obtained from various sources, the reliability of which has not been verified and cannot be guaranteed by SCM, (iv) should not be reproduced or disclosed to any other person, without SCM’s prior consent and (v) is not intended for distribution in any jurisdiction in which its distribution would be prohibited.
In connection with this material, SCM (i) makes no representation or warranties as to the appropriateness or reliance for use in any transaction or as to the permissibility or legality of any financial instrument in any jurisdiction, (ii) believes the information in this material to be reliable, has not independently verified such information and makes no representation, express or implied, with regard to the accuracy or completeness of such information, (iii) accepts no responsibility or liability as to any reliance placed, or investment decision made, on the basis of such information by the recipient and (iv) does not undertake, and disclaims any duty to undertake, to update or to revise the information contained in this material.
Unless otherwise stated, the views, opinions, forecasts, valuations, or estimates contained in this material are those solely of the author, as of the date of publication of this material, and are subject to change without notice. The recipient of this material should make an independent evaluation of this information and make such other investigations as the recipient considers necessary (including obtaining independent financial advice), before transacting in any financial market or instrument discussed in or related to this material.
Important disclaimers for clients in the EU and UK
This publication has been prepared by Trading Desk Strategists within the Sales and Trading functions of Santander US Capital Markets LLC (“SanCap”), the US registered broker-dealer of Santander Corporate & Investment Banking. This communication is distributed in the EEA by Banco Santander S.A., a credit institution registered in Spain and authorised and regulated by the Bank of Spain and the CNMV. Any EEA recipient of this communication that would like to affect any transaction in any security or issuer discussed herein should do so with Banco Santander S.A. or any of its affiliates (together “Santander”). This communication has been distributed in the UK by Banco Santander, S.A.’s London branch, authorised by the Bank of Spain and subject to regulatory oversight on certain matters by the Financial Conduct Authority (FCA) and the Prudential Regulation Authority (PRA).
The publication is intended for exclusive use for Professional Clients and Eligible Counterparties as defined by MiFID II and is not intended for use by retail customers or for any persons or entities in any jurisdictions or country where such distribution or use would be contrary to local law or regulation.
This material is not a product of Santander´s Research Team and does not constitute independent investment research. This is a marketing communication and may contain ¨investment recommendations¨ as defined by the Market Abuse Regulation 596/2014 ("MAR"). This publication has not been prepared in accordance with legal requirements designed to promote the independence of research and is not subject to any prohibition on dealing ahead of the dissemination of investment research. The author, date and time of the production of this publication are as indicated herein.
This publication does not constitute investment advice and may not be relied upon to form an investment decision, nor should it be construed as any offer to sell or issue or invitation to purchase, acquire or subscribe for any instruments referred herein. The publication has been prepared in good faith and based on information Santander considers reliable as of the date of publication, but Santander does not guarantee or represent, express or implied, that such information is accurate or complete. All estimates, forecasts and opinions are current as at the date of this publication and are subject to change without notice. Unless otherwise indicated, Santander does not intend to update this publication. The views and commentary in this publication may not be objective or independent of the interests of the Trading and Sales functions of Santander, who may be active participants in the markets, investments or strategies referred to herein and/or may receive compensation from investment banking and non-investment banking services from entities mentioned herein. Santander may trade as principal, make a market or hold positions in instruments (or related derivatives) and/or hold financial interest in entities discussed herein. Santander may provide market commentary or trading strategies to other clients or engage in transactions which may differ from views expressed herein. Santander may have acted upon the contents of this publication prior to you having received it.
This publication is intended for the exclusive use of the recipient and must not be reproduced, redistributed or transmitted, in whole or in part, without Santander’s consent. The recipient agrees to keep confidential at all times information contained herein.


