The Big Idea
You’re too sensitive
This material is a Marketing Communication and does not constitute Independent Investment Research.
The Fed’s aggressive tightening campaign this year has helped push up bank income from floating-rate loans and securities much faster than bank cost of funds, helping lift earnings along the way. And while banks generally still expect asset income to rise faster than funding costs, the question becomes at what point to start taking steps to reduce that sensitivity and by how much. That shift would help hedge their earnings against potentially lower interest rates. The more interesting choices seem to come on the asset side of the balance sheet.
Banks remain very asset sensitive
Banks describe their assets and liabilities as rate sensitive if the coupon resets within a year. And banks measure net asset sensitivity by looking at net rate sensitive assets—total sensitive assets minus total sensitive liabilities—divided by the bank’s total assets (Exhibit 1). Nearly all the banks in the Amherst Pierpont tracking group show a net asset sensitivity, with the median being around 30. US Bancorp, for example, shows rate sensitive assets as 39% of total assets and rate sensitive liabilities as 9% of total assets, netting to 30.
Exhibit 1: Most banks are asset sensitive
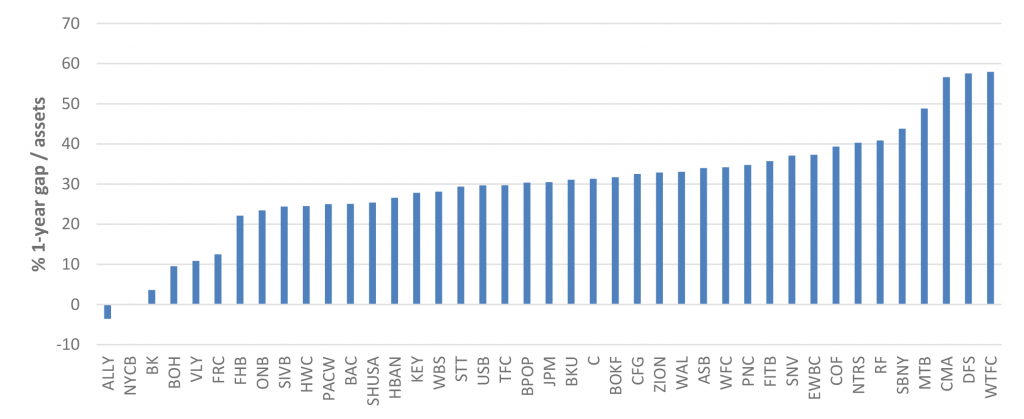
Note: Data shows net rate-sensitive assets divided by total assets.
Source: S&P Capital IQ, Amherst Pierpont Securities
Asset sensitive banks effectively have a short position in interest rates, where rising rates help the income and the overall value of the bank. Reducing asset sensitivity often involves adding net duration.
Methods for reducing asset sensitivity
One simple way that banks can add duration is through security selection. Banks have a range of plausible choices (Exhibit 2). For banks looking to add a lot of duration quickly, the pass-through market offers substantial size at currently attractive yields. When banks have added securities in recent weeks, those have mostly been Ginnie Mae MBS for the added benefit of 0% risk-weight. Separately, Fannie 6% 30-year pass-throughs look very attractive currently from an OAS perspective.
An interesting subset of the pass-through market is 100% New York pools. New York imposes a mortgage recording tax on loans used to purchase or refinance a property, making New York pools relatively slow and relatively more convex. The pay-ups relative to standard TBA pools ramp up very quickly in a rally compared to other story bonds.
Exhibit 2: Longer duration portfolio alternatives

Source: Bloomberg, Amherst Pierpont Securities, as of 10/26/22 and 10/27/22, indicative only
Another strategy that banks should deploy is converting their floating-rate assets to fixed through a receive-fixed swap treated as a cash flow hedge. One of the largest loan growth areas for banks continues to be commercial and industrial loans (Exhibit 3). While business lending was fairly dormant during the pandemic years of 2020 to 2021, it has returned with a vengeance in 2022. Given the large proportion of C&I loans on many bank balance sheets, this could be one of the most expedient ways to add a significant amount of duration, and the cash flow hedge treatment is an attractive accounting outcome for derivatives.
Exhibit 3: Rising balances of C&I loans
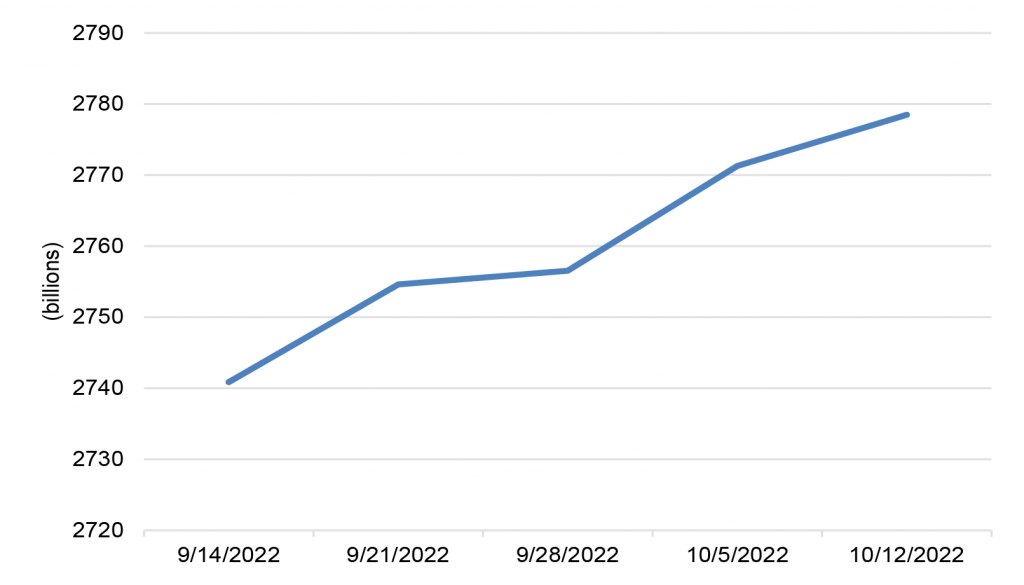
Note: All US commercial banks SA.
Source: Federal Reserve H.8
Similarly, receive-fixed swaps may be used on the liability side of the balance sheet as a fair value hedge to convert fixed-rate debt to floating, helping to increase net interest income in a declining rate environment.
When is the right time to reduce asset sensitivity?
In meetings over recent weeks with several bank chief investment officers and senior portfolio managers, the general consensus is that the US economy will be in a recession within the next 12 to 18 months, which could be accompanied by falling interest rates. Further, most of these executives have expressed the view that banks should be and are now taking some steps to reduce asset sensitivity for a couple of reasons:
Bank earnings have been quite strong. One measure of this is the bank’s net interest margin, where NIM expanded year-over-year for all banks in the tracking group (Exhibit 4).
Exhibit 4: Rising net interest income
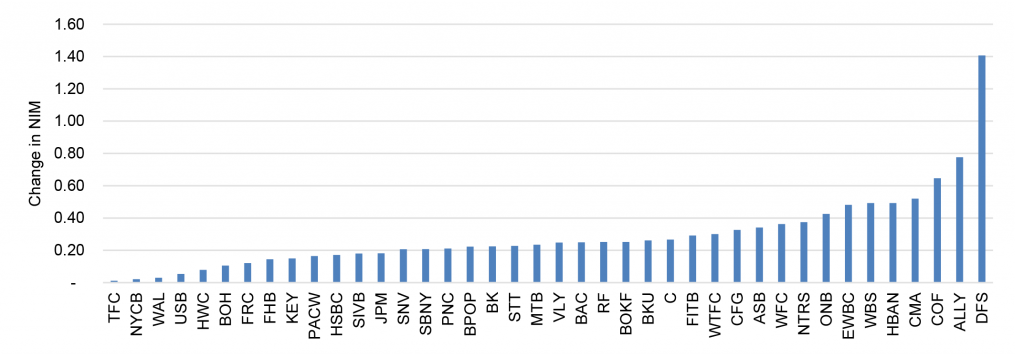
Note: Year-over-year absolute change in NIM, 22Q2.
Source: S&P Capital IQ, Amherst Pierpont Securities
Strong earnings provide the banks with latitude to implement some down-rate protection now, possibly reducing earnings over the short-term but smoothing out their longer-term earnings arc as liability costs gradually catch-up to asset yields.
Another reason to start reducing asset sensitivity now and increasing balance sheet duration is that deposits have been ‘stickier’ than expected in base case projections. While loan-to-deposit ratios have declined in 2022, much of this is due to loan growth. Deposit growth has not kept up with loan growth, but deposits have still generally grown on an absolute basis (Exhibit 5). From an asset-liability management perspective, when banks are able to adjust their liabilities to a longer duration, this allows more flexibility to also extend asset durations and thereby help to reduce asset sensitivity. Note that most of this deposit growth occurred prior to the start of the Fed’s recent tightening cycle in March, and they’ve been generally flat since then.
Exhibit 5: A rising absolute deposit base, although mostly before the start of Fed hikes
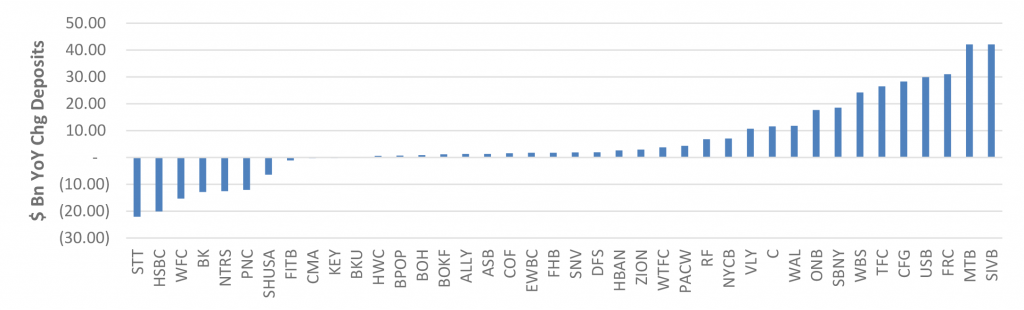
Note: $Billion year-over-year change in deposits
Source: S&P Capital IQ, Amherst Pierpont Securities
Additional asset sensitivity metrics
Aside from measures of net asset sensitivity, another way that banks typically measure and report their asset sensitivity is to look at the impact of interest rate shocks on net interest income. For large rate shocks, the most frequently used is 200 bp, and these are reported by some banks on a gradual shock basis and by others (less commonly) on an immediate shock basis (Exhibits 6A and 6B). Using these shock scenarios, most of the banks in our tracking group are asset sensitive, with the median projected increase in NII of 3.50% for a gradual rate move and 8.38% for an immediate move (meaning the dollars of net interest income are projected to increase by these percentages).
Exhibit 6A: Net interest income impact of a gradual 200 bp rate move
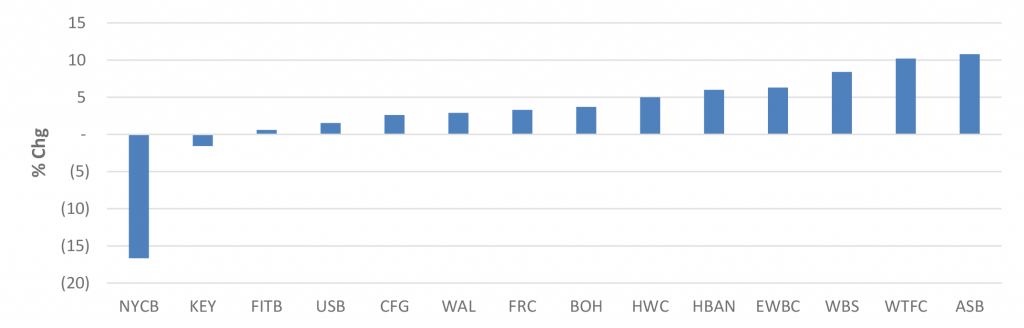
Source: S&P Capital IQ, Amherst Pierpont Securities
Exhibit 6B: Net interest income impact of an immediate 200 bp rate move
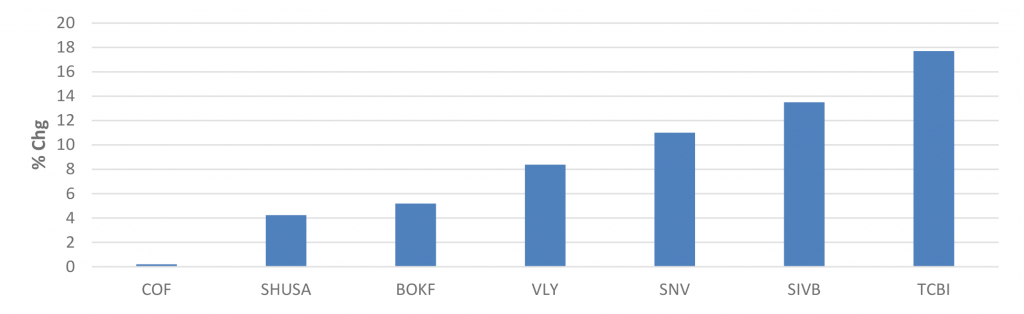
Source: S&P Capital IQ, Amherst Pierpont Securities
This material is intended only for institutional investors and does not carry all of the independence and disclosure standards of retail debt research reports. In the preparation of this material, the author may have consulted or otherwise discussed the matters referenced herein with one or more of SCM’s trading desks, any of which may have accumulated or otherwise taken a position, long or short, in any of the financial instruments discussed in or related to this material. Further, SCM may act as a market maker or principal dealer and may have proprietary interests that differ or conflict with the recipient hereof, in connection with any financial instrument discussed in or related to this material.
This message, including any attachments or links contained herein, is subject to important disclaimers, conditions, and disclosures regarding Electronic Communications, which you can find at https://portfolio-strategy.apsec.com/sancap-disclaimers-and-disclosures.
Important Disclaimers
Copyright © 2026 Santander US Capital Markets LLC and its affiliates (“SCM”). All rights reserved. SCM is a member of FINRA and SIPC. This material is intended for limited distribution to institutions only and is not publicly available. Any unauthorized use or disclosure is prohibited.
In making this material available, SCM (i) is not providing any advice to the recipient, including, without limitation, any advice as to investment, legal, accounting, tax and financial matters, (ii) is not acting as an advisor or fiduciary in respect of the recipient, (iii) is not making any predictions or projections and (iv) intends that any recipient to which SCM has provided this material is an “institutional investor” (as defined under applicable law and regulation, including FINRA Rule 4512 and that this material will not be disseminated, in whole or part, to any third party by the recipient.
The author of this material is an economist, desk strategist or trader. In the preparation of this material, the author may have consulted or otherwise discussed the matters referenced herein with one or more of SCM’s trading desks, any of which may have accumulated or otherwise taken a position, long or short, in any of the financial instruments discussed in or related to this material. Further, SCM or any of its affiliates may act as a market maker or principal dealer and may have proprietary interests that differ or conflict with the recipient hereof, in connection with any financial instrument discussed in or related to this material.
This material (i) has been prepared for information purposes only and does not constitute a solicitation or an offer to buy or sell any securities, related investments or other financial instruments, (ii) is neither research, a “research report” as commonly understood under the securities laws and regulations promulgated thereunder nor the product of a research department, (iii) or parts thereof may have been obtained from various sources, the reliability of which has not been verified and cannot be guaranteed by SCM, (iv) should not be reproduced or disclosed to any other person, without SCM’s prior consent and (v) is not intended for distribution in any jurisdiction in which its distribution would be prohibited.
In connection with this material, SCM (i) makes no representation or warranties as to the appropriateness or reliance for use in any transaction or as to the permissibility or legality of any financial instrument in any jurisdiction, (ii) believes the information in this material to be reliable, has not independently verified such information and makes no representation, express or implied, with regard to the accuracy or completeness of such information, (iii) accepts no responsibility or liability as to any reliance placed, or investment decision made, on the basis of such information by the recipient and (iv) does not undertake, and disclaims any duty to undertake, to update or to revise the information contained in this material.
Unless otherwise stated, the views, opinions, forecasts, valuations, or estimates contained in this material are those solely of the author, as of the date of publication of this material, and are subject to change without notice. The recipient of this material should make an independent evaluation of this information and make such other investigations as the recipient considers necessary (including obtaining independent financial advice), before transacting in any financial market or instrument discussed in or related to this material.
Important disclaimers for clients in the EU and UK
This publication has been prepared by Trading Desk Strategists within the Sales and Trading functions of Santander US Capital Markets LLC (“SanCap”), the US registered broker-dealer of Santander Corporate & Investment Banking. This communication is distributed in the EEA by Banco Santander S.A., a credit institution registered in Spain and authorised and regulated by the Bank of Spain and the CNMV. Any EEA recipient of this communication that would like to affect any transaction in any security or issuer discussed herein should do so with Banco Santander S.A. or any of its affiliates (together “Santander”). This communication has been distributed in the UK by Banco Santander, S.A.’s London branch, authorised by the Bank of Spain and subject to regulatory oversight on certain matters by the Financial Conduct Authority (FCA) and the Prudential Regulation Authority (PRA).
The publication is intended for exclusive use for Professional Clients and Eligible Counterparties as defined by MiFID II and is not intended for use by retail customers or for any persons or entities in any jurisdictions or country where such distribution or use would be contrary to local law or regulation.
This material is not a product of Santander´s Research Team and does not constitute independent investment research. This is a marketing communication and may contain ¨investment recommendations¨ as defined by the Market Abuse Regulation 596/2014 ("MAR"). This publication has not been prepared in accordance with legal requirements designed to promote the independence of research and is not subject to any prohibition on dealing ahead of the dissemination of investment research. The author, date and time of the production of this publication are as indicated herein.
This publication does not constitute investment advice and may not be relied upon to form an investment decision, nor should it be construed as any offer to sell or issue or invitation to purchase, acquire or subscribe for any instruments referred herein. The publication has been prepared in good faith and based on information Santander considers reliable as of the date of publication, but Santander does not guarantee or represent, express or implied, that such information is accurate or complete. All estimates, forecasts and opinions are current as at the date of this publication and are subject to change without notice. Unless otherwise indicated, Santander does not intend to update this publication. The views and commentary in this publication may not be objective or independent of the interests of the Trading and Sales functions of Santander, who may be active participants in the markets, investments or strategies referred to herein and/or may receive compensation from investment banking and non-investment banking services from entities mentioned herein. Santander may trade as principal, make a market or hold positions in instruments (or related derivatives) and/or hold financial interest in entities discussed herein. Santander may provide market commentary or trading strategies to other clients or engage in transactions which may differ from views expressed herein. Santander may have acted upon the contents of this publication prior to you having received it.
This publication is intended for the exclusive use of the recipient and must not be reproduced, redistributed or transmitted, in whole or in part, without Santander’s consent. The recipient agrees to keep confidential at all times information contained herein.


