


The Big Idea
Trading known unknowns
Steven Abrahams | October 28, 2022
This material is a Marketing Communication and does not constitute Independent Investment Research.
The debt markets continue to show extraordinary volatility, and that just reflects the known unknowns about the US economy and how the Fed might need to react. Differences of opinion about inflation and growth, for instance, have rarely been more pronounced. And that makes anticipating the next turn in Fed policy unusually difficult. The market after the November FOMC may want to interpret a Fed downshift from 75 bp hikes to lower ones as a sign of an approaching Fed pause and an eventual ease. That would be premature.
It’s not the Fed
Implied volatility in rates continues to signal uncertainty at levels that have only come at moments of significant stress in market history—the onset of pandemic in March 2020, the Taper Tantrum in 2013, the GFC, the MBS refi waves of 2003 and even the Russia default of 1998. The uncertainty is not coming from the Fed since implied volatility has dropped on FOMC announcement days this year at more than twice the rate of prior years. It will probably drop after the FOMC on November 2. But the uncertainty instead reflects an underlying economy that has become hard to predict.
It’s the economy
The Philadelphia Fed’s Survey of Professional Forecasters has reported measures of forecast dispersion for decades, and those show the magnitude of the current known unknowns. Take headline CPI, to start. The Philly Fed asks its panel to project headline CPI for the current quarter and for each of the four quarters that follow. For each quarter, it then takes the forecast at the 75th percentile and the 25th percentile and calculates the difference as a measure of uncertainty. Those measures of forecast uncertainty for the third quarter of this year—particularly for the four quarters to follow—roughly matched or exceeded levels of the GFC and levels of the early 1980s, when inflation last ran at recent levels (Exhibit 1)
Exhibit 1: Uncertainty about headline CPI matches the GFC and early 1980s
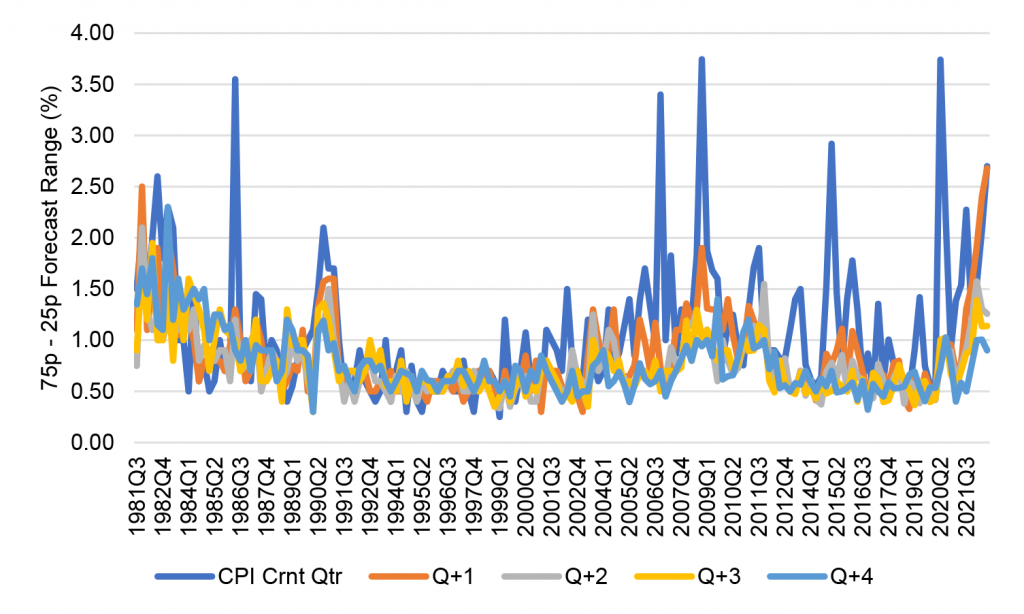
Source: Phila Fed Survey of Professional Forecasters, Amherst Pierpont Securities
The Philly Fed’s series on core CPI is shorter but no less telling. Dispersion of forecasts on core CPI over the next year are at the widest levels since the series started in 2007 (Exhibit 2). Dispersion drops from the most recent quarter to later quarters but remains historically high.
Exhibit 2: Uncertainty about core CPI is the highest in the series
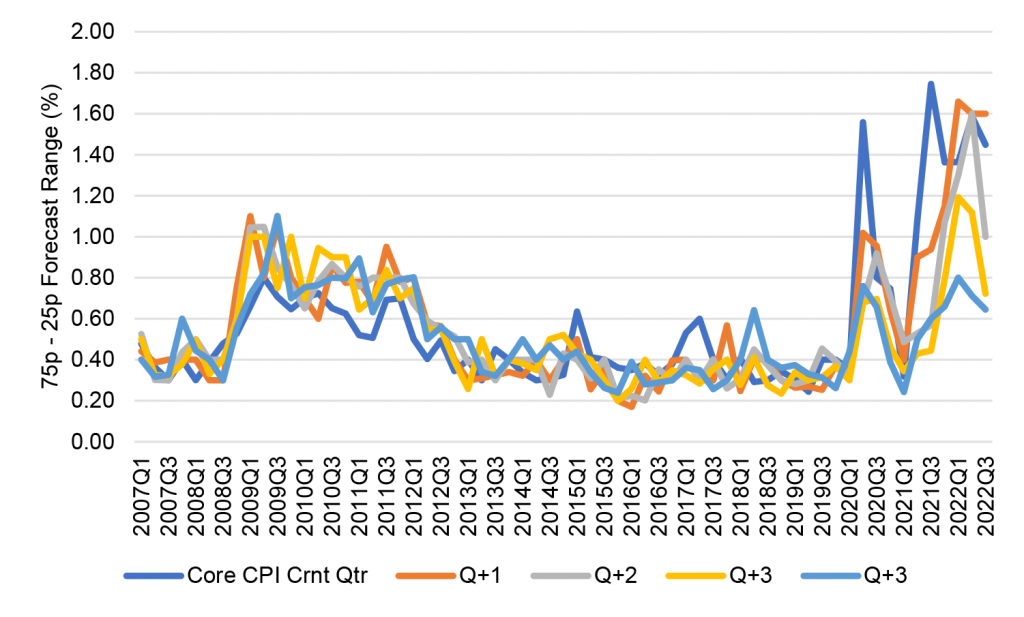
Source: Phila Fed Survey of Professional Forecasters, Amherst Pierpont Securities
And it’s not just inflation where uncertainty has taken hold. Dispersion in forecasts of nominal GDP is similarly wide, partly reflecting dispersion in inflation (Exhibit 3). Nominal dispersion should grow over time with the size of nominal GDP, but percentage dispersion still stands alongside the GFC as a mark of historic differences in expectations.
Exhibit 3: Expectations for nominal GDP differ dramatically
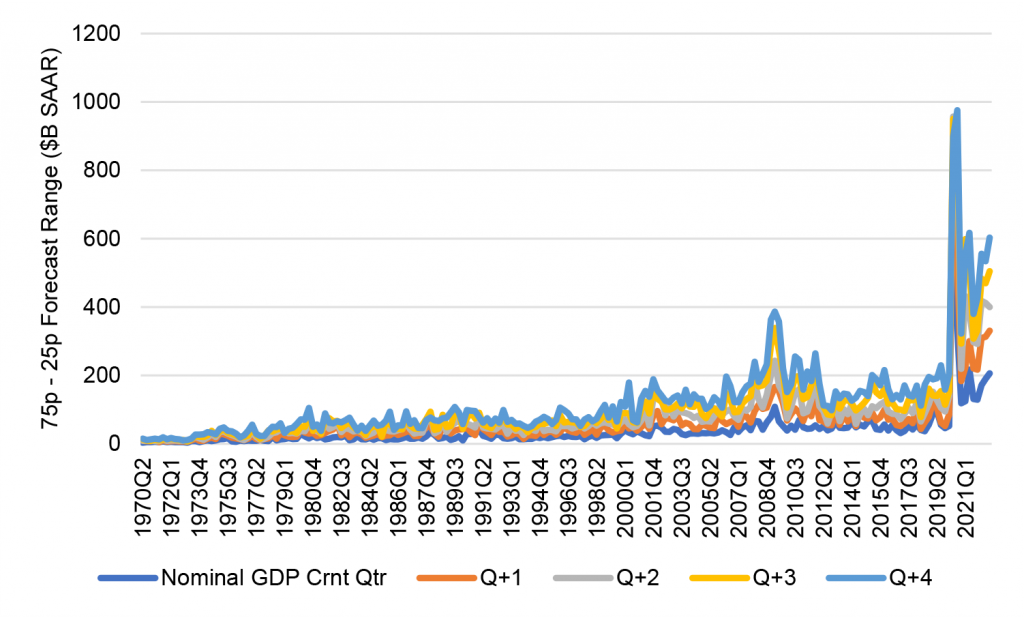
Source: Phila Fed Survey of Professional Forecasters, Amherst Pierpont Securities
Measures of forecast dispersion in nonfarm payrolls, the unemployment rate, private housing starts and other economic basics show similar wide differences of option among the crowd that makes forecasts for a living. The economy coming out of pandemic has become fundamentally harder to predict.
The Fed is highlighting the known unknowns
If you listen carefully to the Fed, it is trying to tell the market the same thing: The most recent FOMC member striking that note was Michelle Bowman on October 12 in a speech to the Money Marketeers of New York University:
…it is not yet clear how high we will need to raise the federal funds rate and how much time will pass before we begin to see inflation moving back down in a consistent and lasting way… My general point is that inflation is much too high, and the outlook for inflation remains significantly uncertain. This uncertainty makes it very challenging to provide precise guidance on the path for the federal funds rate.
The risk of a market working against the Fed
If the market on November 2 interprets indications of slower hikes as a pause preceding an ease—and anecdotally, that is just what many investors expect—that will start to counteract the Fed’s efforts to tighten financial conditions. A tightening in spreads on risk assets and a rally in the longer end of the yield curve would work against the Fed way in advance of any clear indication that Fed policy has brought inflation down, as Governor Bowman specifies, in a consistent and lasting way. That just sets the market up for greater volatility if inflation proves more persistent and the Fed has to start hiking again.
Trading it: Get longer, but stay liquid
Many asset managers probably recognize the long horizon needed to settle all the unknowns about the economy and the Fed’s ultimate reaction. But they also likely recognize that the market can reprice risk well in advance of reliable information. With end investors that want their asset managers to put capital to work and often worry about missing a performance rebound, perhaps the only viable strategy for mark-to-market portfolios is to take calculated risk only in the most liquid of risk assets—agency MBS, investment grade structured products and corporate debt. That would give investors exposure to risk in a market that seems eager to misinterpret a downshift in Fed hikes. But it would also give investors the liquidity to get out of positions if inflation continues proving itself highly unpredictable.
* * *
The view in rates
OIS forward rates still imply fed funds will peak around 4.85% early next year and hold through September 2023. That is roughly consistent with the September FOMC dots. But broad inflation, stoked by shelter and medical costs and tight labor, could make the Fed’s fight harder. There is still risk of repricing the Fed path higher.
Fed RRP balances closed Friday at $2.18 trillion, only slight below the average since June. If the Fed hikes 75 bp in November and 50 bp in December, as fed funds futures now anticipate, yields on Treasury bills into early 2023 now trade below the likely forward rates on RRP cash. Money market funds have little alternative but to put proceeds into RRP
.
Settings on 3-month LIBOR have closed Friday at 441 bp, higher by 5 bp on the week. Setting on 3-month term SOFR closed Friday at 409 bp, higher by 3 bp. The spread between 3-month SOFR and LIBOR has widened from 10 bp in early October to 32 bp lately, likely reflecting the higher cost of bank borrowing over yearend.
Further out the curve, the 2-year note closed Friday at 4.41%, roughly fair value based on Fed dots through 2024. The 10-year note closed well above fundamental fair value at 4.01%, so the higher yield has to get chalked up to a market seeing or expecting supply to overwhelm demand. It is shaping up to be a long and volatile winter for the rates market.
The Treasury yield curve has finished its most recent session with 2s10s at -40 bp, flatter by 15 bp on the week. The 5s30s finished the most recent session at -4 bp, flatter by 4 bp on the week. The 2s10s curve looks likely to invert by around 70 bp shortly before Fed tightening comes to an end. That is a trade for some time next year.
Breakeven 10-year inflation finished the week at 250 bp, down by 4 bp from a week before. The 10-year real rate finished the week at 152 bp, down by 16 bp on the week.
The view in spreads
Volatility should continue while the Fed’s path stays in flux. It is becoming increasingly clear that Fed emphasis on data—and the uncertainty of the data itself—has created much more uncertainty than the benchmark tightening cycle of 2004 through 2006. That makes news on growth, inflation, unemployment and policy much more important in this market. And the higher informational content adds to realized volatility. Both MBS and credit have widened steadily since mid-August. Nominal par 30-year MBS spreads to the blend of 5- and 10-year Treasury yields finished the most recent session at 164 bp, tighter by 9 bp on the week. Par 30-year MBS OAS finished the week at 57 bp, tighter by 7 bp on the week. Investment grade cash credit spreads have finished the week at 184 bp over the SOFR curve, tighter by 8 bp.
The view in credit
Credit fundamentals have started to soften with the weakest credits showing slower revenue growth so far in 2022, declining free operating cash flow and less cash on the balance sheet. Ahead lays weaker demand, margin pressure, a soft housing market and various risks from Covid and supply interruptions. Inflation will land differently across different balance sheets. A recent New York Fed study argues inflation generally helps companies lift gross margins, although airlines and leisure may have an easier time passing through costs than healthcare, retail and restaurants. In leveraged loans, a higher real cost of funds would start to eat away at highly leveraged balance sheets with weak or volatile revenues. Consumer balance sheets look strong with rising income, substantial savings and big gains in real estate and investment portfolios. Homeowner equity jumped by $3.5 trillion in 2021, and mortgage delinquencies have dropped to a record low. But inflation and recession could take a toll and add credit risk to consumer balance sheets.