By the Numbers
Pandemic risk dissipates while refi risk rises
This material is a Marketing Communication and does not constitute Independent Investment Research.
Fannie Mae’s multifamily delinquency rates are not yet back to pre-Covid levels, but the bulk of loans that entered forbearance have already cured and defaults have so far been modest. The bigger risk is arguably the upcoming maturity wall. More than 10% of Fannie Mae’s existing multifamily portfolio matures over the next three years and virtually all of it will need to be refinanced at considerably higher rates.
Progress on multifamily credit
Despite heightened recession fears, most commercial real estate loan performance has continued to gradually improve from the pandemic-driven peaks of delinquencies and defaults. Agency multifamily loan performance benefitted tremendously from the government-sponsored forbearance programs. Delinquency rates at Fannie Mae surged from less than 0.1% before the pandemic to 1.3% at the peak in late 2020 and early 2021 (Exhibit 1). This was nearly twice as high as peak delinquency rates of almost 0.8% in 2010 in the wake of the housing-led financial crisis.
Exhibit 1: Fannie Mae multifamily historical delinquency rates
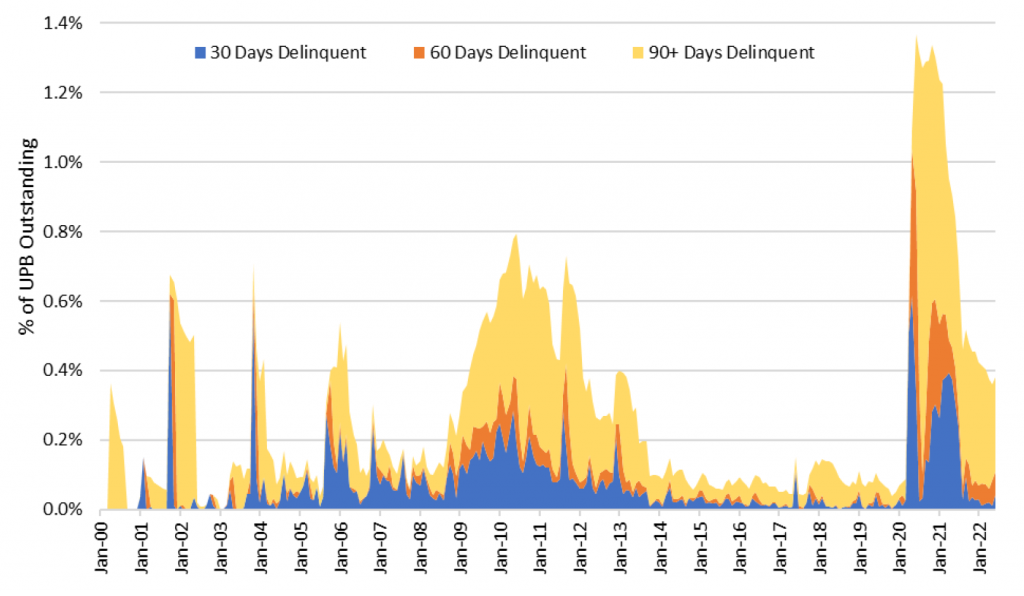
Note: Data through Q2 2022.
Source: Fannie Mae, Amherst Pierpont Securities
Loans that were put into Covid-19 forbearance were marked delinquent at Fannie Mae but were allowed to cure over time after exiting forbearance. Beginning in early 2021, those loans began to exit forbearance and enter repayment. The bulk of the loans that entered forbearance gradually cured over time and returned to performing status. Currently $1.6 billion across 143 loans, or 0.38% of the unpaid principal balance (UPB) of Fannie’s multifamily portfolio, is delinquent (Exhibit 2). About half of that is still in repayment after exiting forbearance. The other half of the delinquent loans are in some stage of workout, most of which never entered forbearance.
Exhibit 2: Fannie Mae multifamily current delinquency status
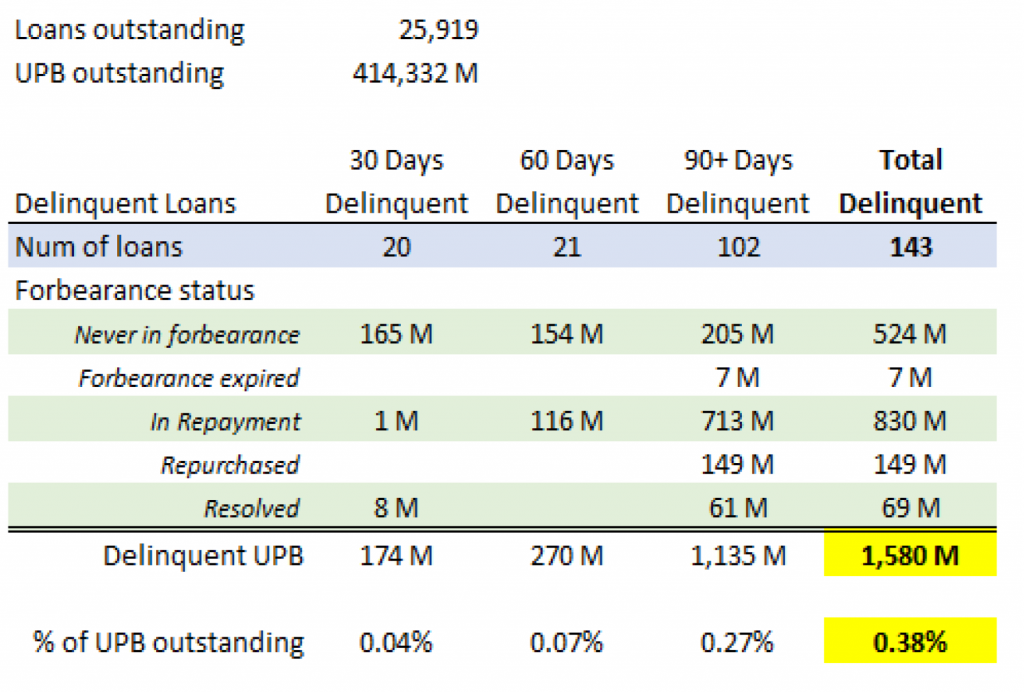
Note: Current unpaid principal balance in millions; data thru Q2 2022.
Source: Fannie Mae, Amherst Pierpont Securities
Some portion of the loans in repayment, $830 million or 0.20% of the outstanding principal balance, will likely ultimately default and enter workout. Worst case scenario might assume all 143 loans comprising 0.38% of outstanding and currently delinquent UPB ultimately default. Compared to the historical default rates and losses primarily incurred due to the financial crisis, those incremental defaults would be rather modest. Assuming a historical loss severity of 31%, that 38 bp of defaults would generate 12 bp of losses. That’s less than the cumulative losses from the 2009 vintage alone, which was the best performing vintage of the first decade of the 2000s. The overall performance of Fannie Mae’s portfolio has been quite strong (Exhibit 3). The pandemic crisis in agency multifamily looks like it has been largely resolved and contained.
Exhibit 3: Fannie Mae multifamily performance summary

Note: Loan UPB at acquisition in millions; data thru Q2 2022.
Source: Fannie Mae, Amherst Pierpont Securities
A wall of refinancings
One of the primary concerns in commercial real estate going forward is that maturing loans will need new financing, and that financing is largely going to be at considerably higher rates. That’s true for agency CMBS as well. Nearly 11% of Fannie Mae’s outstanding multifamily portfolio matures over the next three years (Exhibit 4). The average note rate on the existing loans is 4.5%, which is roughly 100 to 150 bp below current DUS 10/9.5 rates, depending on property tier and other credit factors.
Exhibit 4: Upcoming multifamily maturities at Fannie Mae
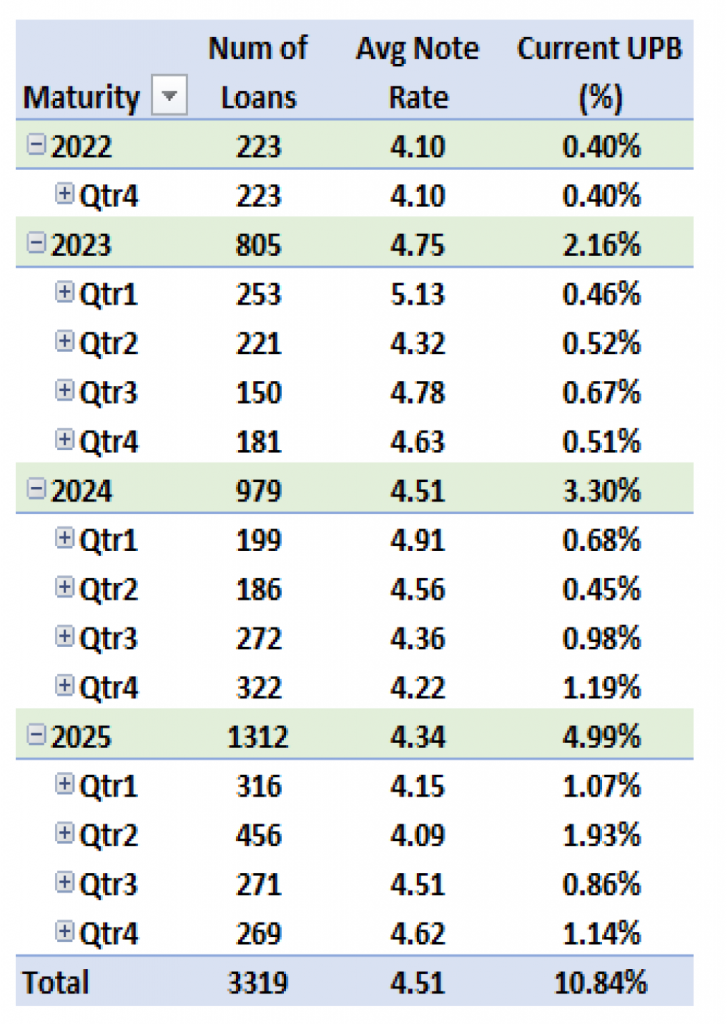
Note: Data through Q2 2022.
Source: Fannie Mae, Amherst Pierpont Securities
The upside is that the maturing loans have benefitted from up to 10 years of exceptionally strong property price appreciation. Existing borrowers should be able to refinance relatively easily at the higher rates, even if they need to do so at a lower loan to value (LTV) in order to maintain an acceptable debt service coverage ratio (DSCR). Those owners who wish to sell the property may find the environment less favorable. Commercial real estate prices generally have already started to decline modestly month-over-month, and that trend is expected to continue well into next year. New investors are going to demand higher cap rates given the higher cost of financing, which will put more pressure on sellers.
On the upside, the fewest properties mature in 2023, and those already have the highest average existing note rate at 4.75%. The benefits of accumulated price appreciation and the lowest average jump in financing costs should limit any potential wave of delinquencies. By 2024 or 2025 the Fed could be in an easing cycle and rates could be roughly flat to those of maturing loans, though prices could also be at a local trough. Even in a recession scenario of higher rates and lower prices, the maturity wall in agency CMBS is unlikely to result in a pile-up of delinquencies and defaults, but some speed bumps due to local losses are to be expected.
This material is intended only for institutional investors and does not carry all of the independence and disclosure standards of retail debt research reports. In the preparation of this material, the author may have consulted or otherwise discussed the matters referenced herein with one or more of SCM’s trading desks, any of which may have accumulated or otherwise taken a position, long or short, in any of the financial instruments discussed in or related to this material. Further, SCM may act as a market maker or principal dealer and may have proprietary interests that differ or conflict with the recipient hereof, in connection with any financial instrument discussed in or related to this material.
This message, including any attachments or links contained herein, is subject to important disclaimers, conditions, and disclosures regarding Electronic Communications, which you can find at https://portfolio-strategy.apsec.com/sancap-disclaimers-and-disclosures.
Important Disclaimers
Copyright © 2026 Santander US Capital Markets LLC and its affiliates (“SCM”). All rights reserved. SCM is a member of FINRA and SIPC. This material is intended for limited distribution to institutions only and is not publicly available. Any unauthorized use or disclosure is prohibited.
In making this material available, SCM (i) is not providing any advice to the recipient, including, without limitation, any advice as to investment, legal, accounting, tax and financial matters, (ii) is not acting as an advisor or fiduciary in respect of the recipient, (iii) is not making any predictions or projections and (iv) intends that any recipient to which SCM has provided this material is an “institutional investor” (as defined under applicable law and regulation, including FINRA Rule 4512 and that this material will not be disseminated, in whole or part, to any third party by the recipient.
The author of this material is an economist, desk strategist or trader. In the preparation of this material, the author may have consulted or otherwise discussed the matters referenced herein with one or more of SCM’s trading desks, any of which may have accumulated or otherwise taken a position, long or short, in any of the financial instruments discussed in or related to this material. Further, SCM or any of its affiliates may act as a market maker or principal dealer and may have proprietary interests that differ or conflict with the recipient hereof, in connection with any financial instrument discussed in or related to this material.
This material (i) has been prepared for information purposes only and does not constitute a solicitation or an offer to buy or sell any securities, related investments or other financial instruments, (ii) is neither research, a “research report” as commonly understood under the securities laws and regulations promulgated thereunder nor the product of a research department, (iii) or parts thereof may have been obtained from various sources, the reliability of which has not been verified and cannot be guaranteed by SCM, (iv) should not be reproduced or disclosed to any other person, without SCM’s prior consent and (v) is not intended for distribution in any jurisdiction in which its distribution would be prohibited.
In connection with this material, SCM (i) makes no representation or warranties as to the appropriateness or reliance for use in any transaction or as to the permissibility or legality of any financial instrument in any jurisdiction, (ii) believes the information in this material to be reliable, has not independently verified such information and makes no representation, express or implied, with regard to the accuracy or completeness of such information, (iii) accepts no responsibility or liability as to any reliance placed, or investment decision made, on the basis of such information by the recipient and (iv) does not undertake, and disclaims any duty to undertake, to update or to revise the information contained in this material.
Unless otherwise stated, the views, opinions, forecasts, valuations, or estimates contained in this material are those solely of the author, as of the date of publication of this material, and are subject to change without notice. The recipient of this material should make an independent evaluation of this information and make such other investigations as the recipient considers necessary (including obtaining independent financial advice), before transacting in any financial market or instrument discussed in or related to this material.
Important disclaimers for clients in the EU and UK
This publication has been prepared by Trading Desk Strategists within the Sales and Trading functions of Santander US Capital Markets LLC (“SanCap”), the US registered broker-dealer of Santander Corporate & Investment Banking. This communication is distributed in the EEA by Banco Santander S.A., a credit institution registered in Spain and authorised and regulated by the Bank of Spain and the CNMV. Any EEA recipient of this communication that would like to affect any transaction in any security or issuer discussed herein should do so with Banco Santander S.A. or any of its affiliates (together “Santander”). This communication has been distributed in the UK by Banco Santander, S.A.’s London branch, authorised by the Bank of Spain and subject to regulatory oversight on certain matters by the Financial Conduct Authority (FCA) and the Prudential Regulation Authority (PRA).
The publication is intended for exclusive use for Professional Clients and Eligible Counterparties as defined by MiFID II and is not intended for use by retail customers or for any persons or entities in any jurisdictions or country where such distribution or use would be contrary to local law or regulation.
This material is not a product of Santander´s Research Team and does not constitute independent investment research. This is a marketing communication and may contain ¨investment recommendations¨ as defined by the Market Abuse Regulation 596/2014 ("MAR"). This publication has not been prepared in accordance with legal requirements designed to promote the independence of research and is not subject to any prohibition on dealing ahead of the dissemination of investment research. The author, date and time of the production of this publication are as indicated herein.
This publication does not constitute investment advice and may not be relied upon to form an investment decision, nor should it be construed as any offer to sell or issue or invitation to purchase, acquire or subscribe for any instruments referred herein. The publication has been prepared in good faith and based on information Santander considers reliable as of the date of publication, but Santander does not guarantee or represent, express or implied, that such information is accurate or complete. All estimates, forecasts and opinions are current as at the date of this publication and are subject to change without notice. Unless otherwise indicated, Santander does not intend to update this publication. The views and commentary in this publication may not be objective or independent of the interests of the Trading and Sales functions of Santander, who may be active participants in the markets, investments or strategies referred to herein and/or may receive compensation from investment banking and non-investment banking services from entities mentioned herein. Santander may trade as principal, make a market or hold positions in instruments (or related derivatives) and/or hold financial interest in entities discussed herein. Santander may provide market commentary or trading strategies to other clients or engage in transactions which may differ from views expressed herein. Santander may have acted upon the contents of this publication prior to you having received it.
This publication is intended for the exclusive use of the recipient and must not be reproduced, redistributed or transmitted, in whole or in part, without Santander’s consent. The recipient agrees to keep confidential at all times information contained herein.


