By the Numbers
FICO and GEO lead the way in discount prepays
This material is a Marketing Communication and does not constitute Independent Investment Research.
Mortgage rates above 7% have pushed prices for most MBS well below par, leaving investors hunting for faster prepayment speeds to boost returns. But extensive history to guide prepayment decisions for this kind of market is hard to come by. Evidence from the past six months nevertheless shows low-credit borrowers, condos and co-ops, and borrowers from states like Tennessee, Colorado, Arizona, and Utah have offered the biggest boost to discount prepayment speeds.
Historical prepayment data for discount environments has been limited since interest rates have trended lower since the early 1980s. When interest rates did increase, it was usually not long before rates fell again and sent the MBS market into another refinance wave. But the market does have increasing evidence from 2022.
The biggest speedup in discount prepayments has come from picking the right states. Tennessee prepaid 18% faster than average, for example, while New York prepaid 18% slower than average; that means Tennessee loans prepaid almost 40% faster than New York loans. Many states such as Tennessee, Colorado and Arizona posted speeds from 10% to 20% faster than the average state (Exhibit 1). The fast states typically have had stronger housing markets and more population growth as people migrated to those states—those two things often being linked. Northeastern states tended to have more outmigration, lowering housing demand. And places like New York have expensive mortgage taxes that also suppress housing turnover.
Exhibit 1: Different states have big differences in prepayment speeds.
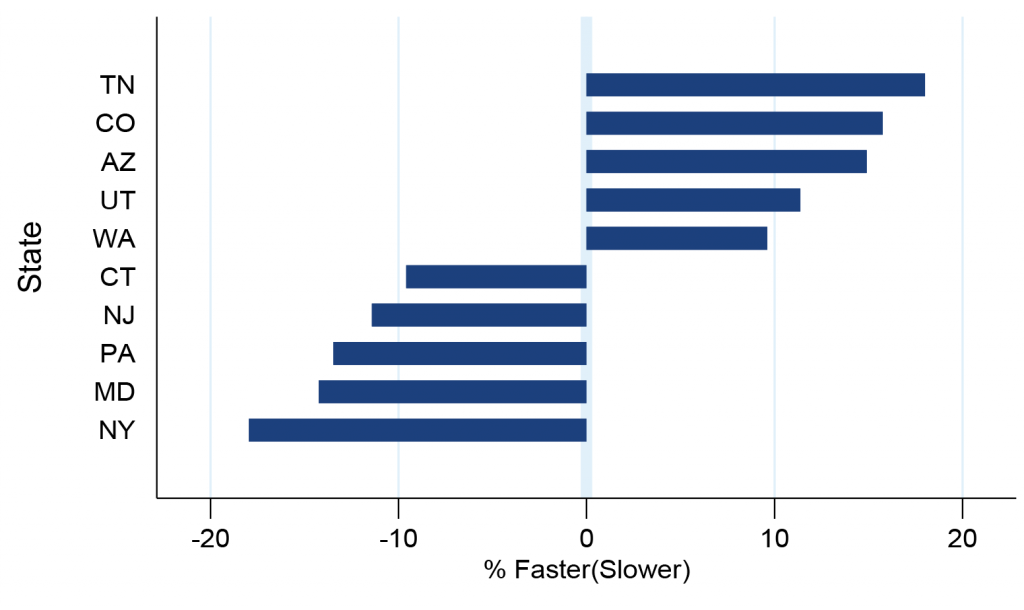
Shows the 5 fastest and 5 slowest states after excluding small volume states.
Source: Fannie Mae, Freddie Mac, Amherst Pierpont Securities.
The exhibit shows the percent faster or slower a loan in each state prepaid compared to the average state, after controlling for other collateral characteristics like gross coupon, loan age, loan size, property type, servicer, and other attributes. Each of the following exhibits follows the same process—show the effect of one attribute while holding all the rest constant. Performance covers only out-of-the-money loans from April through September.
However, it can be a challenge to monetize geography and other turnover stories. Most specified pools were built to protect against fast prepayments, not slow turnover. Some stories—low loan balance, for example—offer both. But otherwise it is difficult to find pure geography stories outside of New York, Florida, Texas, and Puerto Rico. But the speed differences due to geography can be big enough that pools with a higher concentration of faster or slower states may prepay differently, and the market might not be pricing them to account for these differences.
In new issue, it might be possible to assemble a pool of fast turnover states that do not provide refinance protection for a nominal, or no, pay-up. This used to be more challenging because originators were able to sell more jumbo loans into TBA pools if they also included low pay-up loans. But agency jumbo production has slowed from a combination of higher loan limits, higher mortgage rates, and better jumbo execution in non-agency securitizations. So a lot of originators are operating below the de minimis limit and might be more willing to create low pay-up specified pools.
Condominiums and co-ops have been turning over faster than other property types (Exhibit 2). This could reflect that people who buy condos and co-ops are more likely to need a larger home in the future. There is also a small difference between planned urban developments and normal single-family homes. This might be a geographic difference at the MSA-level that can’t be controlled for since Fannie Mae and Freddie Mac only disclose each loan’s state. Manufactured housing has been prepaying slower than average.
Exhibit 2: Condos and co-ops tend to prepay faster than other loan types.
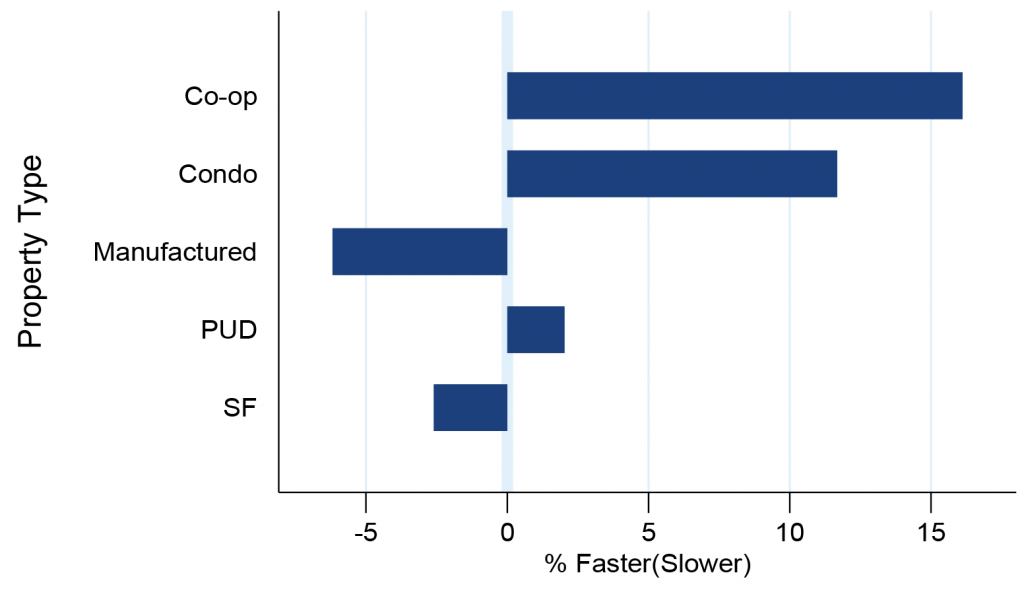
Source: Fannie Mae, Freddie Mac, Amherst Pierpont Securities.
Low-credit borrowers typically prepay faster in a discount environment (Exhibit 3). There is a steady progression from slower to faster as credit score declines. Low-credit borrowers tend to move more frequently, since they often experience income growth, credit curing, and growing families that need larger homes. They also are more likely to do a cash-out refinance even if that means forfeiting a low rate on their current loan. And default rates may also be higher. The swings can be large; for example, there is about a 10% speed difference between the 700–725 FICO bucket and the 775–800 FICO bucket.
Exhibit 3: Borrowers with low credit scores have been prepaying faster.
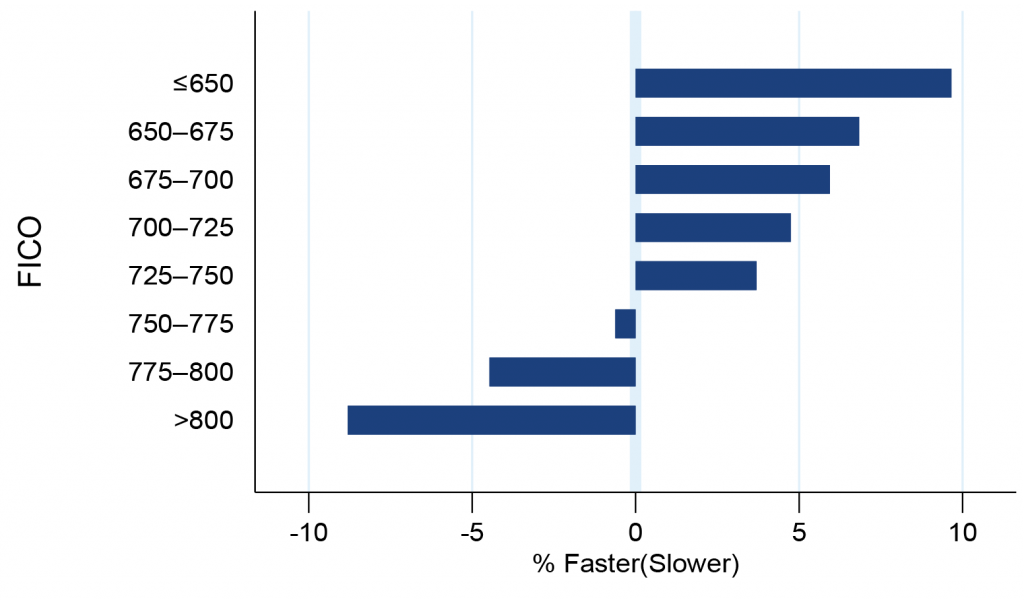
Source: Fannie Mae, Freddie Mac, Amherst Pierpont Securities.
A couple servicers that are known to prepay quickly in a refinance environment have maintained that status as the market shifted to a purchase environment (Exhibit 4). Quicken and loanDepot are well ahead of other servicers, which was also true of their discount pools during the pandemic. Both are known to have strong cash-out refinance businesses, which likely explains the difference. Bank servicers tend to be a little slower than average.
Exhibit 4: Quicken and loanDepot maintained faster speeds in a turnover environment.
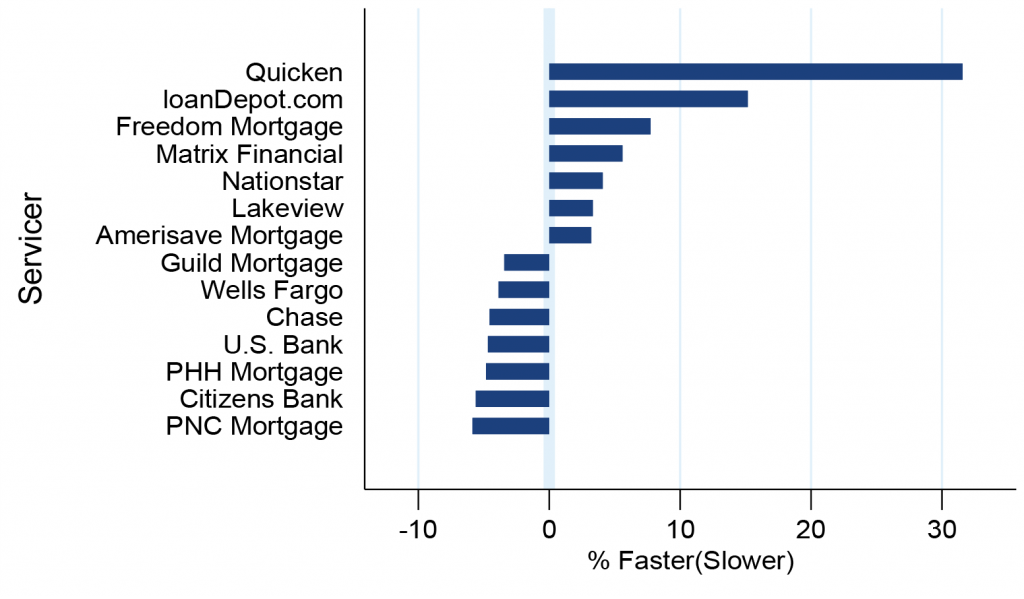
Source: Fannie Mae, Freddie Mac, Amherst Pierpont Securities.
It has been known for a while that loans with smaller balances tend to turnover faster. These borrowers are typically younger and are more likely to need a larger home. The LLB (≤$85,000) bucket is exceptionally fast, although the amount of production in those sizes is dwindling, a result of fast home price appreciation over the last two years.
Exhibit 5: Smaller balance loans have faster housing turnover.
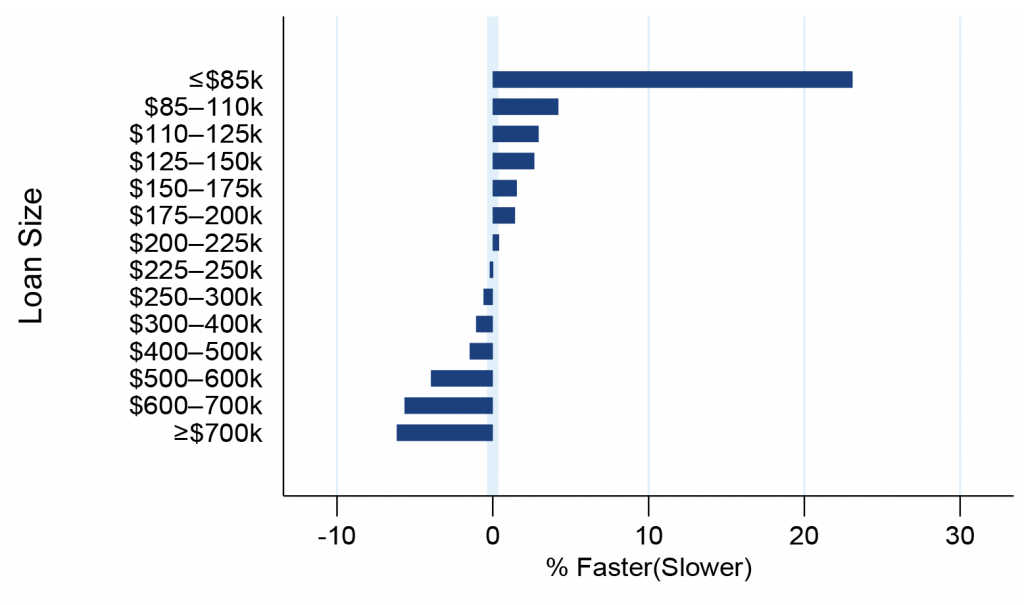
Source: Fannie Mae, Freddie Mac, Amherst Pierpont Securities.
A few other attributes had only small effects on turnover speeds. This included current LTV, presence of mortgage insurance, first time home buyers, and loan purpose.
Small speed differences can have a large effect on value for pools priced below par (Exhibit 6). The table shows how much the price of each TBA increases or decreases if turnover is 5%, 10%, or 20% faster or slower than the base case speed shown. In the most extreme case—a 20% move in housing turnover for FNCL 1.5%s—the price can change by more than 25/32s.
Exhibit 6: Theoretical pay-up for scenarios of faster or slower housing turnover (32s)
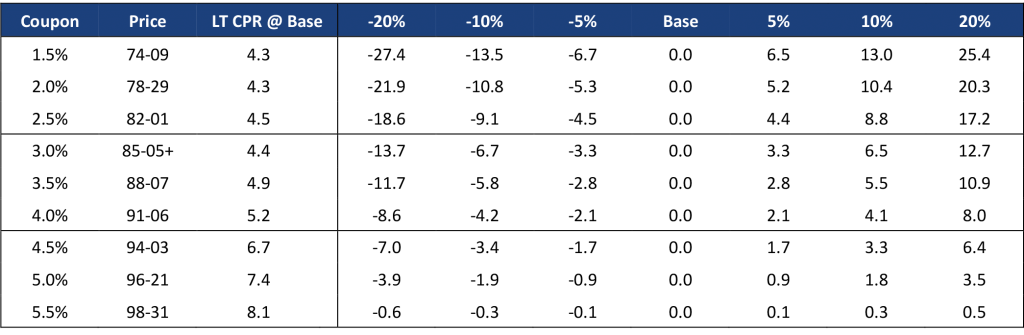
Pay-up in 32\s using Yield Book’s production model for % faster/ or slower housing turnover over the model’s base-case projections.
Source: Fannie Mae, Freddie Mac, Yield Book, Amherst Pierpont Securities.
This material is intended only for institutional investors and does not carry all of the independence and disclosure standards of retail debt research reports. In the preparation of this material, the author may have consulted or otherwise discussed the matters referenced herein with one or more of SCM’s trading desks, any of which may have accumulated or otherwise taken a position, long or short, in any of the financial instruments discussed in or related to this material. Further, SCM may act as a market maker or principal dealer and may have proprietary interests that differ or conflict with the recipient hereof, in connection with any financial instrument discussed in or related to this material.
This message, including any attachments or links contained herein, is subject to important disclaimers, conditions, and disclosures regarding Electronic Communications, which you can find at https://portfolio-strategy.apsec.com/sancap-disclaimers-and-disclosures.
Important Disclaimers
Copyright © 2026 Santander US Capital Markets LLC and its affiliates (“SCM”). All rights reserved. SCM is a member of FINRA and SIPC. This material is intended for limited distribution to institutions only and is not publicly available. Any unauthorized use or disclosure is prohibited.
In making this material available, SCM (i) is not providing any advice to the recipient, including, without limitation, any advice as to investment, legal, accounting, tax and financial matters, (ii) is not acting as an advisor or fiduciary in respect of the recipient, (iii) is not making any predictions or projections and (iv) intends that any recipient to which SCM has provided this material is an “institutional investor” (as defined under applicable law and regulation, including FINRA Rule 4512 and that this material will not be disseminated, in whole or part, to any third party by the recipient.
The author of this material is an economist, desk strategist or trader. In the preparation of this material, the author may have consulted or otherwise discussed the matters referenced herein with one or more of SCM’s trading desks, any of which may have accumulated or otherwise taken a position, long or short, in any of the financial instruments discussed in or related to this material. Further, SCM or any of its affiliates may act as a market maker or principal dealer and may have proprietary interests that differ or conflict with the recipient hereof, in connection with any financial instrument discussed in or related to this material.
This material (i) has been prepared for information purposes only and does not constitute a solicitation or an offer to buy or sell any securities, related investments or other financial instruments, (ii) is neither research, a “research report” as commonly understood under the securities laws and regulations promulgated thereunder nor the product of a research department, (iii) or parts thereof may have been obtained from various sources, the reliability of which has not been verified and cannot be guaranteed by SCM, (iv) should not be reproduced or disclosed to any other person, without SCM’s prior consent and (v) is not intended for distribution in any jurisdiction in which its distribution would be prohibited.
In connection with this material, SCM (i) makes no representation or warranties as to the appropriateness or reliance for use in any transaction or as to the permissibility or legality of any financial instrument in any jurisdiction, (ii) believes the information in this material to be reliable, has not independently verified such information and makes no representation, express or implied, with regard to the accuracy or completeness of such information, (iii) accepts no responsibility or liability as to any reliance placed, or investment decision made, on the basis of such information by the recipient and (iv) does not undertake, and disclaims any duty to undertake, to update or to revise the information contained in this material.
Unless otherwise stated, the views, opinions, forecasts, valuations, or estimates contained in this material are those solely of the author, as of the date of publication of this material, and are subject to change without notice. The recipient of this material should make an independent evaluation of this information and make such other investigations as the recipient considers necessary (including obtaining independent financial advice), before transacting in any financial market or instrument discussed in or related to this material.
Important disclaimers for clients in the EU and UK
This publication has been prepared by Trading Desk Strategists within the Sales and Trading functions of Santander US Capital Markets LLC (“SanCap”), the US registered broker-dealer of Santander Corporate & Investment Banking. This communication is distributed in the EEA by Banco Santander S.A., a credit institution registered in Spain and authorised and regulated by the Bank of Spain and the CNMV. Any EEA recipient of this communication that would like to affect any transaction in any security or issuer discussed herein should do so with Banco Santander S.A. or any of its affiliates (together “Santander”). This communication has been distributed in the UK by Banco Santander, S.A.’s London branch, authorised by the Bank of Spain and subject to regulatory oversight on certain matters by the Financial Conduct Authority (FCA) and the Prudential Regulation Authority (PRA).
The publication is intended for exclusive use for Professional Clients and Eligible Counterparties as defined by MiFID II and is not intended for use by retail customers or for any persons or entities in any jurisdictions or country where such distribution or use would be contrary to local law or regulation.
This material is not a product of Santander´s Research Team and does not constitute independent investment research. This is a marketing communication and may contain ¨investment recommendations¨ as defined by the Market Abuse Regulation 596/2014 ("MAR"). This publication has not been prepared in accordance with legal requirements designed to promote the independence of research and is not subject to any prohibition on dealing ahead of the dissemination of investment research. The author, date and time of the production of this publication are as indicated herein.
This publication does not constitute investment advice and may not be relied upon to form an investment decision, nor should it be construed as any offer to sell or issue or invitation to purchase, acquire or subscribe for any instruments referred herein. The publication has been prepared in good faith and based on information Santander considers reliable as of the date of publication, but Santander does not guarantee or represent, express or implied, that such information is accurate or complete. All estimates, forecasts and opinions are current as at the date of this publication and are subject to change without notice. Unless otherwise indicated, Santander does not intend to update this publication. The views and commentary in this publication may not be objective or independent of the interests of the Trading and Sales functions of Santander, who may be active participants in the markets, investments or strategies referred to herein and/or may receive compensation from investment banking and non-investment banking services from entities mentioned herein. Santander may trade as principal, make a market or hold positions in instruments (or related derivatives) and/or hold financial interest in entities discussed herein. Santander may provide market commentary or trading strategies to other clients or engage in transactions which may differ from views expressed herein. Santander may have acted upon the contents of this publication prior to you having received it.
This publication is intended for the exclusive use of the recipient and must not be reproduced, redistributed or transmitted, in whole or in part, without Santander’s consent. The recipient agrees to keep confidential at all times information contained herein.


